> ## Documentation Index
> Fetch the complete documentation index at: https://docs.cognigy.com/llms.txt
> Use this file to discover all available pages before exploring further.
# Engagement
Updated in 2025.19
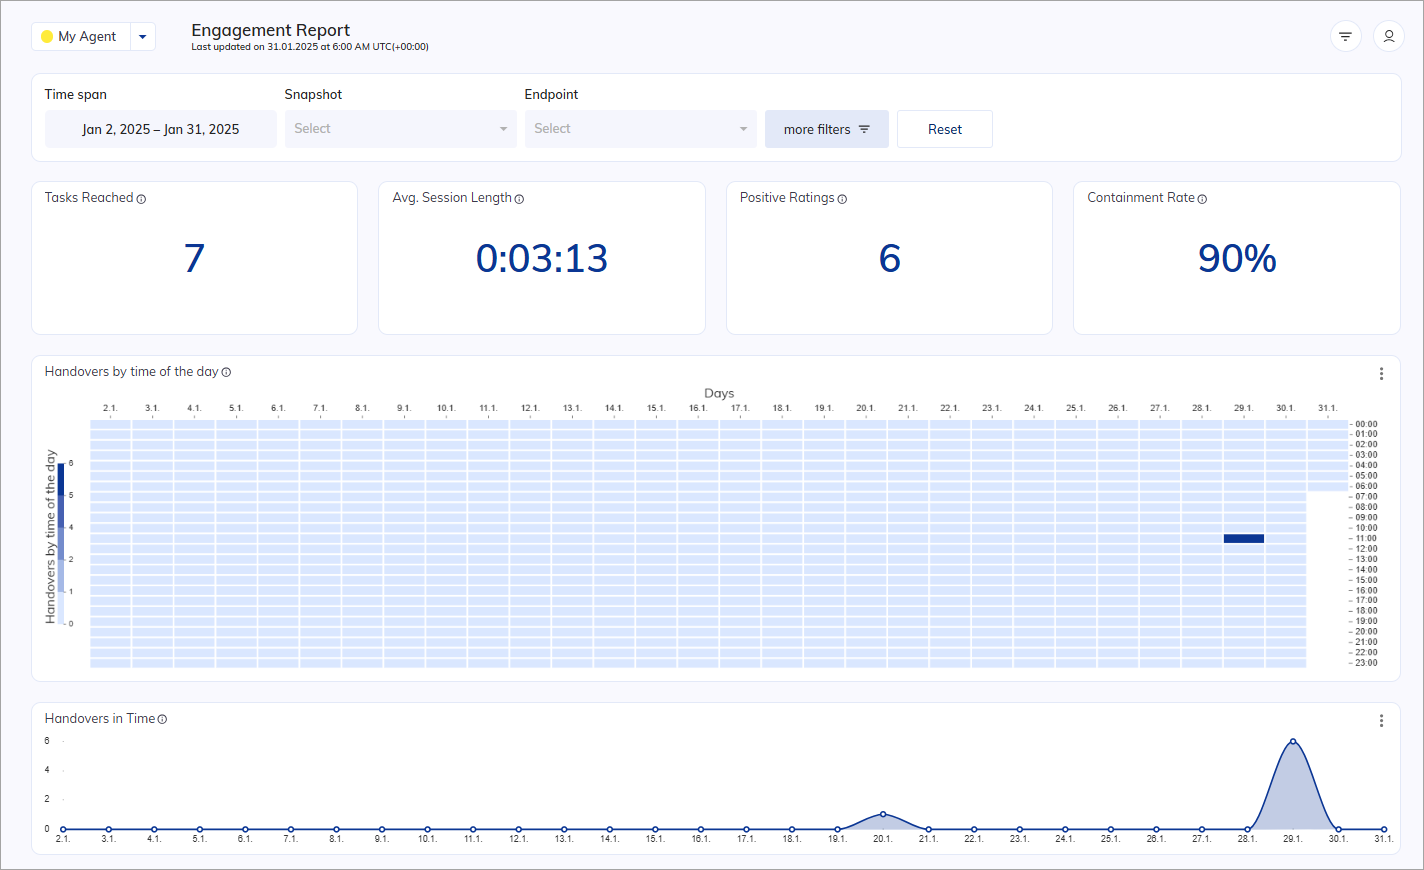
The *Engagement Report* highlights customer interactions in conversations and visualizes the engagement performance of your AI Agent in the following charts:
* [Indicators](/insights/reports/engagement#indicators)
* [Heat maps](/insights/reports/engagement#heat-maps)
* [Bar charts](/insights/reports/engagement#bar-charts)
* [Line charts](/insights/reports/engagement#line-charts)
Charts display data based on the [global filter](https://docs.cognigy.com/insights/global-filters/) settings.
 ## Indicators
The Indicator charts display real-time data that refreshes every 30 seconds.
### Tasks reached
This chart displays the total number of [completed tasks](/ai/agents/develop/node-reference/analytics/complete-task).
Source table:
```txt theme={null}
| StartedAt | Sessions | Tasks | Tasks reached |
| ---------- | ----------- | ------------------------ | ------------- |
| 2022/01/01 | session-123 | "Goal A, Goal B, Goal D" | 3 |
| 2022/01/01 | session-456 | "Goal B, Goal C, Goal E" | 3 |
| 2022/01/03 | session-789 | "Goal B, Goal E" | 2 |
| 2022/01/03 | session-abc | "Goal B" | 1 |
| 2022/01/05 | session-def | "Goal A, Goal B" | 2 |
```
Result: `11`
### Avg. Session length
Displays how long the average session lasted.
The session length is defined as the time difference between the timestamp of the first user input and the last user input.
The Average session length is the mean of all session lengths within the specified time span in your Insights filter.
Source table:
```txt theme={null}
| StartedAt | EndedAt | Sessions |
| ------------------- | ------------------- | ----------- |
| 2022/01/01 12:15 00 | 2022/01/01 12:18 00 | session-123 |
| 2022/01/01 14:00 00 | 2022/01/01 15:00 00 | session-456 |
| 2022/01/03 09:05 30 | 2022/01/03 09:15 30 | session-789 |
| 2022/01/03 11:30 00 | 2022/01/03 11:44 00 | session-abc |
| 2022/01/05 06:10 00 | 2022/01/05 06:20 00 | session-def |
```
Calculation:
1. Length for a particular session `Max(timestamp) - Min(timestamp)`.
2. `Length of all sessions / total number of sessions`.
Example:
1. Total Length = `3 minutes + 1 hour + 10 minutes + 14 minutes + 10 minutes = 1 hour 37 minutes`
2. Average Session Length = `1 hour 37 minutes / 5 = 19 minutes and 24 seconds`
Result: `00:19:24`
### Positive Ratings
Displays the total number of Positive Ratings the end user has given.
Source table:
```txt theme={null}
| Sessions | Positive Rating | Negative Rating | Rated Sessions |
| ----------- | --------------- | --------------- | -------------- |
| session-123 | 1 | 0 | 1 |
| session-456 | 0 | 1 | 1 |
| session-789 | 0 | 0 | 0 |
| session-abc | 1 | 0 | 1 |
| session-def | 1 | 0 | 1 |
| ---------------------------------------------------------------- |
| TOTAL | 3 | 1 | 4 |
```
Result: `3`
### Containment Rate
Displays containment rate. The containment rate is calculated by the ratio of sessions without any handover to all sessions.
Source table:
```txt theme={null}
| Session ID | Handovers | Handover Sessions | Sessions |
| ----------- | ----------| ----------------- | -------- |
| session-123 | 3 | 1 | 1 |
| session-456 | 0 | 0 | 1 |
| session-789 | 0 | 0 | 1 |
| session-abc | 2 | 1 | 1 |
| session-def | 1 | 1 | 1 |
| ------------------------------------------------------ |
| TOTAL | 6 | 3 | 5 |
```
Formula:
1. Containment Rate = `1 - (Handover included Sessions)/(Total Sessions)`.
2. Percentage `Containment Rate * 100%`.
Result: `40%`
## Heat maps
### Handovers by time of the day
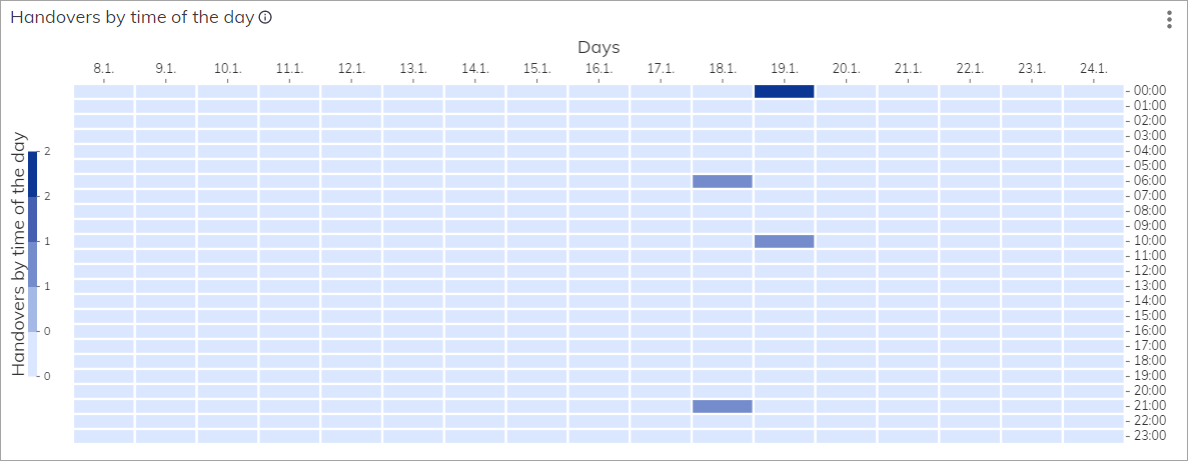
Displays the number of times a human agent is contacted during the day. Multiple handovers can occur within a single session.
Source table:
```txt theme={null}
| DateTime | Handover |
| --------------- | ---------- |
| 01/8/2023 16:00 | 0 |
| 01/8/2023 17:00 | 0 |
| 01/9/2023 00:00 | 0 |
| 1/11/2023 15:00 | 0 |
| 1/15/2023 18:00 | 0 |
| 1/16/2023 21:00 | 0 |
| 1/17/2023 11:00 | 0 |
| 1/18/2023 06:00 | 1 |
| 1/18/2023 21:00 | 1 |
| 1/19/2023 00:00 | 2 |
| 1/19/2023 10:00 | 1 |
| 1/23/2023 13:00 | 0 |
| 1/24/2023 23:00 | 0 |
```
Result:
## Indicators
The Indicator charts display real-time data that refreshes every 30 seconds.
### Tasks reached
This chart displays the total number of [completed tasks](/ai/agents/develop/node-reference/analytics/complete-task).
Source table:
```txt theme={null}
| StartedAt | Sessions | Tasks | Tasks reached |
| ---------- | ----------- | ------------------------ | ------------- |
| 2022/01/01 | session-123 | "Goal A, Goal B, Goal D" | 3 |
| 2022/01/01 | session-456 | "Goal B, Goal C, Goal E" | 3 |
| 2022/01/03 | session-789 | "Goal B, Goal E" | 2 |
| 2022/01/03 | session-abc | "Goal B" | 1 |
| 2022/01/05 | session-def | "Goal A, Goal B" | 2 |
```
Result: `11`
### Avg. Session length
Displays how long the average session lasted.
The session length is defined as the time difference between the timestamp of the first user input and the last user input.
The Average session length is the mean of all session lengths within the specified time span in your Insights filter.
Source table:
```txt theme={null}
| StartedAt | EndedAt | Sessions |
| ------------------- | ------------------- | ----------- |
| 2022/01/01 12:15 00 | 2022/01/01 12:18 00 | session-123 |
| 2022/01/01 14:00 00 | 2022/01/01 15:00 00 | session-456 |
| 2022/01/03 09:05 30 | 2022/01/03 09:15 30 | session-789 |
| 2022/01/03 11:30 00 | 2022/01/03 11:44 00 | session-abc |
| 2022/01/05 06:10 00 | 2022/01/05 06:20 00 | session-def |
```
Calculation:
1. Length for a particular session `Max(timestamp) - Min(timestamp)`.
2. `Length of all sessions / total number of sessions`.
Example:
1. Total Length = `3 minutes + 1 hour + 10 minutes + 14 minutes + 10 minutes = 1 hour 37 minutes`
2. Average Session Length = `1 hour 37 minutes / 5 = 19 minutes and 24 seconds`
Result: `00:19:24`
### Positive Ratings
Displays the total number of Positive Ratings the end user has given.
Source table:
```txt theme={null}
| Sessions | Positive Rating | Negative Rating | Rated Sessions |
| ----------- | --------------- | --------------- | -------------- |
| session-123 | 1 | 0 | 1 |
| session-456 | 0 | 1 | 1 |
| session-789 | 0 | 0 | 0 |
| session-abc | 1 | 0 | 1 |
| session-def | 1 | 0 | 1 |
| ---------------------------------------------------------------- |
| TOTAL | 3 | 1 | 4 |
```
Result: `3`
### Containment Rate
Displays containment rate. The containment rate is calculated by the ratio of sessions without any handover to all sessions.
Source table:
```txt theme={null}
| Session ID | Handovers | Handover Sessions | Sessions |
| ----------- | ----------| ----------------- | -------- |
| session-123 | 3 | 1 | 1 |
| session-456 | 0 | 0 | 1 |
| session-789 | 0 | 0 | 1 |
| session-abc | 2 | 1 | 1 |
| session-def | 1 | 1 | 1 |
| ------------------------------------------------------ |
| TOTAL | 6 | 3 | 5 |
```
Formula:
1. Containment Rate = `1 - (Handover included Sessions)/(Total Sessions)`.
2. Percentage `Containment Rate * 100%`.
Result: `40%`
## Heat maps
### Handovers by time of the day
Displays the number of times a human agent is contacted during the day. Multiple handovers can occur within a single session.
Source table:
```txt theme={null}
| DateTime | Handover |
| --------------- | ---------- |
| 01/8/2023 16:00 | 0 |
| 01/8/2023 17:00 | 0 |
| 01/9/2023 00:00 | 0 |
| 1/11/2023 15:00 | 0 |
| 1/15/2023 18:00 | 0 |
| 1/16/2023 21:00 | 0 |
| 1/17/2023 11:00 | 0 |
| 1/18/2023 06:00 | 1 |
| 1/18/2023 21:00 | 1 |
| 1/19/2023 00:00 | 2 |
| 1/19/2023 10:00 | 1 |
| 1/23/2023 13:00 | 0 |
| 1/24/2023 23:00 | 0 |
```
Result:
 ## Bar charts
### Containment Rate
Updated in 4.48
Indicates the percentage of sessions without any handover during the timeline.
Source table:
```txt theme={null}
| Date | Containment Rate | Total Sessions | Handover included Sessions |
| --------- | --------------- | -------------- | -------------------------- |
| 3/1/2023 | 87.5 | 40 | 35 |
| 3/2/2023 | 82.60869565 | 46 | 38 |
| 3/3/2023 | 96.77419355 | 62 | 60 |
| 3/6/2023 | 92.5 | 40 | 37 |
| 3/7/2023 | 100 | 58 | 58 |
| 3/8/2023 | 100 | 92 | 92 |
| 3/10/2023 | 100 | 10 | 10 |
```
Formula:
1. Containment Rate = `1 - (Handover included Sessions)/(Total Sessions)`.
2. Percentage `Containment Rate * 100%`.
Example for the 3/1/2023: `(35/40)* 100% = 87.5%`
Result:
## Bar charts
### Containment Rate
Updated in 4.48
Indicates the percentage of sessions without any handover during the timeline.
Source table:
```txt theme={null}
| Date | Containment Rate | Total Sessions | Handover included Sessions |
| --------- | --------------- | -------------- | -------------------------- |
| 3/1/2023 | 87.5 | 40 | 35 |
| 3/2/2023 | 82.60869565 | 46 | 38 |
| 3/3/2023 | 96.77419355 | 62 | 60 |
| 3/6/2023 | 92.5 | 40 | 37 |
| 3/7/2023 | 100 | 58 | 58 |
| 3/8/2023 | 100 | 92 | 92 |
| 3/10/2023 | 100 | 10 | 10 |
```
Formula:
1. Containment Rate = `1 - (Handover included Sessions)/(Total Sessions)`.
2. Percentage `Containment Rate * 100%`.
Example for the 3/1/2023: `(35/40)* 100% = 87.5%`
Result:
 ## Line charts
### Handovers in Time
Displays the number of times a human agent was contacted within the filtered time span. Multiple handovers can occur within a single session.
By clicking
## Line charts
### Handovers in Time
Displays the number of times a human agent was contacted within the filtered time span. Multiple handovers can occur within a single session.
By clicking  ,
you can select **Go to Step Explorer**,
which leads you to the Step Explorer in Insights.
Source table:
```txt theme={null}
| DateTime | Handovers per day |
|------------|-------------------|
| 4/11/2023 | 3 |
| 4/12/2023 | 0 |
| 4/13/2023 | 24 |
| 4/14/2023 | 8 |
| 4/17/2023 | 17 |
| 4/18/2023 | 12 |
| 4/20/2023 | 5 |
| 4/21/2023 | 5 |
```
Result:
,
you can select **Go to Step Explorer**,
which leads you to the Step Explorer in Insights.
Source table:
```txt theme={null}
| DateTime | Handovers per day |
|------------|-------------------|
| 4/11/2023 | 3 |
| 4/12/2023 | 0 |
| 4/13/2023 | 24 |
| 4/14/2023 | 8 |
| 4/17/2023 | 17 |
| 4/18/2023 | 12 |
| 4/20/2023 | 5 |
| 4/21/2023 | 5 |
```
Result:
 ### Positive Ratings over Time
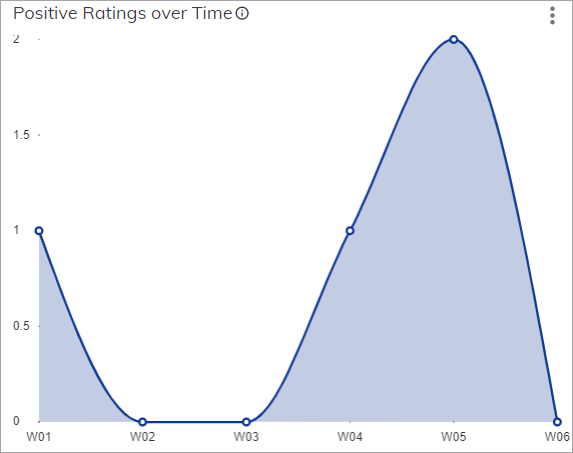
Displays the total number of Positive Ratings given as feedback by the end user.
Source table:
```txt theme={null}
| Date (weeks) | Positive | Negative | Number of Ratings |
| ------------ | -------- | -------- | ----------------- |
| 2023-W01 | 1 | 0 | 1 |
| 2023-W04 | 1 | 0 | 1 |
| 2023-W05 | 2 | 0 | 2 |
```
Result:
### Positive Ratings over Time
Displays the total number of Positive Ratings given as feedback by the end user.
Source table:
```txt theme={null}
| Date (weeks) | Positive | Negative | Number of Ratings |
| ------------ | -------- | -------- | ----------------- |
| 2023-W01 | 1 | 0 | 1 |
| 2023-W04 | 1 | 0 | 1 |
| 2023-W05 | 2 | 0 | 2 |
```
Result:
 ### Unique Contacts
Displays the number of unique contacts (`userid`) in relation to the selected timespan. If the user creates more than one session in a single day, it will be counted as one unique contact for that day.
Source table:
```txt theme={null}
| Date | Contacts |
| --------- | -------- |
| 1/16/2023 | 1 |
| 1/17/2023 | 8 |
| 1/18/2023 | 15 |
| 1/19/2023 | 6 |
| 1/20/2023 | 18 |
```
Result:
### Unique Contacts
Displays the number of unique contacts (`userid`) in relation to the selected timespan. If the user creates more than one session in a single day, it will be counted as one unique contact for that day.
Source table:
```txt theme={null}
| Date | Contacts |
| --------- | -------- |
| 1/16/2023 | 1 |
| 1/17/2023 | 8 |
| 1/18/2023 | 15 |
| 1/19/2023 | 6 |
| 1/20/2023 | 18 |
```
Result:
 ## Download Report
To download a report as a CSV file for the chart,
click in the upper-right corner of the chart.
To create a report file, refer to the [Download Report](https://docs.cognigy.com/insights/download-reports/) article.
## More Information
* [Overview](/insights/reports/overview)
* [Goals Report](/insights/reports/goals)
* [NLU Performance Report](/insights/reports/nlu-performance)
* [Live Agent Report](/insights/reports/live-agent)
## Download Report
To download a report as a CSV file for the chart,
click in the upper-right corner of the chart.
To create a report file, refer to the [Download Report](https://docs.cognigy.com/insights/download-reports/) article.
## More Information
* [Overview](/insights/reports/overview)
* [Goals Report](/insights/reports/goals)
* [NLU Performance Report](/insights/reports/nlu-performance)
* [Live Agent Report](/insights/reports/live-agent)