> ## Documentation Index
> Fetch the complete documentation index at: https://docs.cognigy.com/llms.txt
> Use this file to discover all available pages before exploring further.
# NLU Performance
Updated in 2025.19
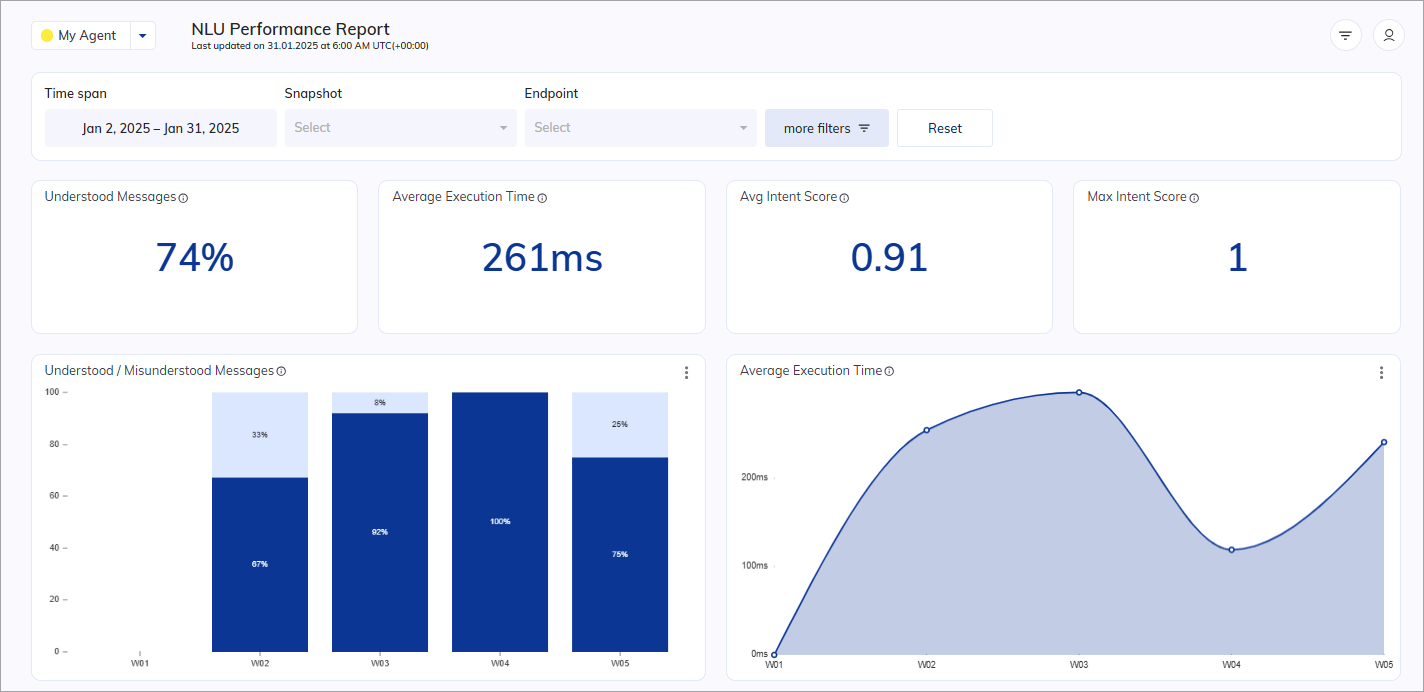
The *NLU Performance Report* provides valuable insights into the performance of your AI Agent's natural language understanding (NLU) capabilities. It allows you to monitor and enhance message comprehension, Intent recognition, and execution efficiency. Moreover, it offers easy access to resources like the Intent Trainer for further performance improvement.
You can find more information about our NLU and Intents in the [NLU Overview](/ai/platform-features/nlu/overview) article.
The NLU Performance data of your AI Agent is visualized in the following charts:
* [Indicators](/insights/reports/engagement#indicators)
* [Bar charts](/insights/reports/engagement#bar-charts)
* [Line charts](/insights/reports/engagement#line-charts)
These charts display all data based on the [global filter](/insights/global-filters) and local filter settings.
 ## Indicators
The Indicator charts present real-time data that refreshes every 30 seconds.
### Average Execution Time
Displays the average execution time across a specific timespan.
Formula:
Average Execution Time = `Sum of Execution Times / Total number of inputs`
### Avg Intent Score
Displays the average Intent score for the selected time span. Higher Intent scores indicate better AI Agent performance in matching user queries.
For more information, see [Machine Learning Intents](/ai/platform-features/nlu/intents/overview).
To find the average intent score, Insights sums up all the intent scores and divides the sum by the total number of records.
Source table:
```txt theme={null}
| Analytics Record | Intent Score |
| ---------------- | ------------ |
| Record-1 | 0.30 |
| Record-2 | 0.90 |
| Record-3 | 0.10 |
| Record-4 | 1 |
| Record-5 | 0.20 |
| Record-6 | 0.02 |
| Record-7 | 0.50 |
```
Calculation:
1. Sum of Intent Scores = `0.30 + 0.90 + 0.10 + 1 + 0.20 + 0.02 + 0.50 = 3.02`
2. Number of Records = `7`
3. Average Intent Score = `(Sum of Intent Scores) / (Number of Records)`
4. Average Intent Score = `3.02 / 7`
Result: `0.43`
### Max Intent Score
Indicates the number of Intents that were matched with 100% efficacy.
Source table:
```txt theme={null}
| Analytics Record | Intent Score |
| ---------------- | ------------ |
| Record-1 | 0.30 |
| Record-2 | 0.90 |
| Record-3 | 0.10 |
| Record-4 | 1 |
| Record-5 | 0.20 |
| Record-6 | 0.02 |
| Record-7 | 0.50 |
```
Result: In the provided source table, there is one record with an intent score of `1`, so the max intent score is `1`.
## Bar charts
### Top Intents
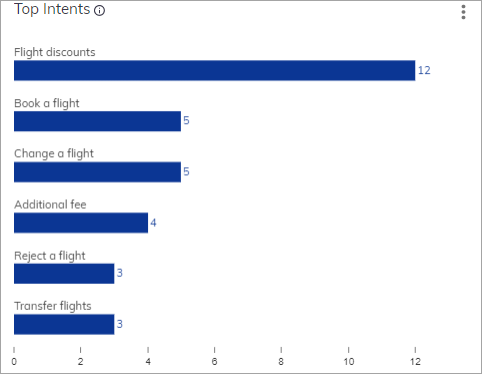
Displays the top-rated number of Intents. The summary view shows a maximum of 6 Intents, while the detailed view displays up to 25. Matching an Intent triggers its recording in the analytics data. The data is then grouped by the matched Intent and sorted in descending order.
Source table:
```txt theme={null}
| Intent | Total number |
| ----------------- | ------------- |
| Flight discounts | 12 |
| Book a flight | 5 |
| Change a flight | 5 |
| Additional fee | 4 |
| Reject a flight | 3 |
| Transfer flights | 3 |
```
Result:
## Indicators
The Indicator charts present real-time data that refreshes every 30 seconds.
### Average Execution Time
Displays the average execution time across a specific timespan.
Formula:
Average Execution Time = `Sum of Execution Times / Total number of inputs`
### Avg Intent Score
Displays the average Intent score for the selected time span. Higher Intent scores indicate better AI Agent performance in matching user queries.
For more information, see [Machine Learning Intents](/ai/platform-features/nlu/intents/overview).
To find the average intent score, Insights sums up all the intent scores and divides the sum by the total number of records.
Source table:
```txt theme={null}
| Analytics Record | Intent Score |
| ---------------- | ------------ |
| Record-1 | 0.30 |
| Record-2 | 0.90 |
| Record-3 | 0.10 |
| Record-4 | 1 |
| Record-5 | 0.20 |
| Record-6 | 0.02 |
| Record-7 | 0.50 |
```
Calculation:
1. Sum of Intent Scores = `0.30 + 0.90 + 0.10 + 1 + 0.20 + 0.02 + 0.50 = 3.02`
2. Number of Records = `7`
3. Average Intent Score = `(Sum of Intent Scores) / (Number of Records)`
4. Average Intent Score = `3.02 / 7`
Result: `0.43`
### Max Intent Score
Indicates the number of Intents that were matched with 100% efficacy.
Source table:
```txt theme={null}
| Analytics Record | Intent Score |
| ---------------- | ------------ |
| Record-1 | 0.30 |
| Record-2 | 0.90 |
| Record-3 | 0.10 |
| Record-4 | 1 |
| Record-5 | 0.20 |
| Record-6 | 0.02 |
| Record-7 | 0.50 |
```
Result: In the provided source table, there is one record with an intent score of `1`, so the max intent score is `1`.
## Bar charts
### Top Intents
Displays the top-rated number of Intents. The summary view shows a maximum of 6 Intents, while the detailed view displays up to 25. Matching an Intent triggers its recording in the analytics data. The data is then grouped by the matched Intent and sorted in descending order.
Source table:
```txt theme={null}
| Intent | Total number |
| ----------------- | ------------- |
| Flight discounts | 12 |
| Book a flight | 5 |
| Change a flight | 5 |
| Additional fee | 4 |
| Reject a flight | 3 |
| Transfer flights | 3 |
```
Result:
 ### Top Slots
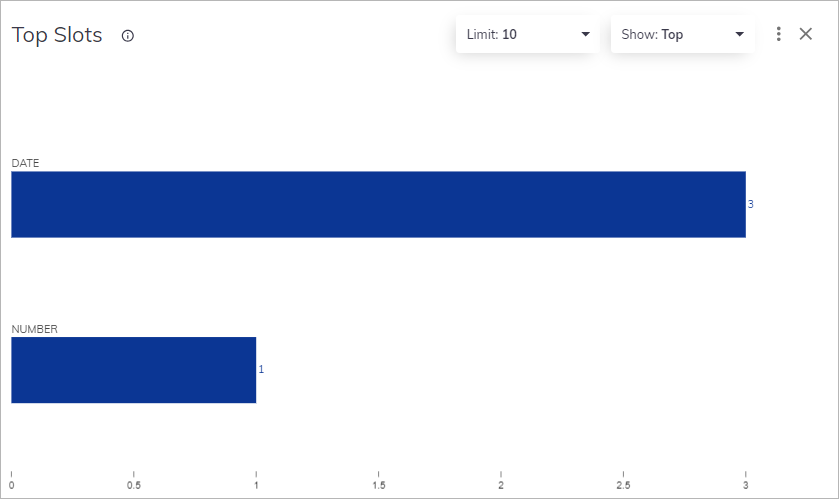
Similar to **Top Tasks** and **Top Intents**, this chart displays top-rated number of slots in a horizontal bar chart.
Source table:
```txt theme={null}
| Slot | Number |
| ----------- | ----------- |
| DATE | 2 |
| NUMBER | 1 |
```
Result:
### Top Slots
Similar to **Top Tasks** and **Top Intents**, this chart displays top-rated number of slots in a horizontal bar chart.
Source table:
```txt theme={null}
| Slot | Number |
| ----------- | ----------- |
| DATE | 2 |
| NUMBER | 1 |
```
Result:
 ### Intents by Score Range
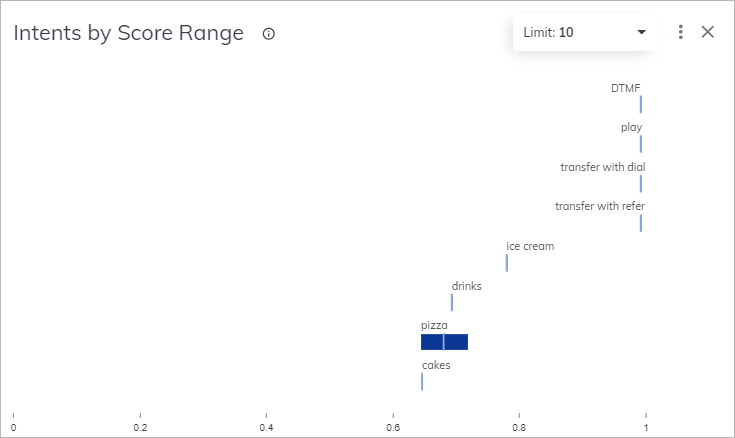
Displays the scoring range of matched Intents. Each score range is displayed as a bar with minimum, maximum, and average values.
Clicking on the three-dots menu item,
you can select the **Go to Intent Trainer** that leads you to the application in Cognigy.AI to improve your Flow.
For more information, see [Intent Trainer](/ai/platform-features/nlu/intents/intent-trainer).
Source table:
```txt theme={null}
| Date | intentScoreAvg | intentScoreMax | intentScoreMin |
| ------------------ | -------------- | -------------- | ------------------ |
| cakes | 0.6517875252045072 | 0.6517875252045072 | 0.6517875252045072 |
| pizza | 0.6863160928710601 | 0.7237952611766103 | 0.6491475952551133 |
| drinks | 0.698537294767418 | 0.698537294767418 | 0.698537294767418 |
| ice cream | 0.7862064089630107 | 0.7862064089630107 | 0.7862064089630107 |
| transfer with refer| 1 | 1 | 1 |
| transfer with dial | 1 | 1 | 1 |
| play | 1 | 1 | 1 |
| DTMF | 1 | 1 | 1 |
```
Result:
### Intents by Score Range
Displays the scoring range of matched Intents. Each score range is displayed as a bar with minimum, maximum, and average values.
Clicking on the three-dots menu item,
you can select the **Go to Intent Trainer** that leads you to the application in Cognigy.AI to improve your Flow.
For more information, see [Intent Trainer](/ai/platform-features/nlu/intents/intent-trainer).
Source table:
```txt theme={null}
| Date | intentScoreAvg | intentScoreMax | intentScoreMin |
| ------------------ | -------------- | -------------- | ------------------ |
| cakes | 0.6517875252045072 | 0.6517875252045072 | 0.6517875252045072 |
| pizza | 0.6863160928710601 | 0.7237952611766103 | 0.6491475952551133 |
| drinks | 0.698537294767418 | 0.698537294767418 | 0.698537294767418 |
| ice cream | 0.7862064089630107 | 0.7862064089630107 | 0.7862064089630107 |
| transfer with refer| 1 | 1 | 1 |
| transfer with dial | 1 | 1 | 1 |
| play | 1 | 1 | 1 |
| DTMF | 1 | 1 | 1 |
```
Result:
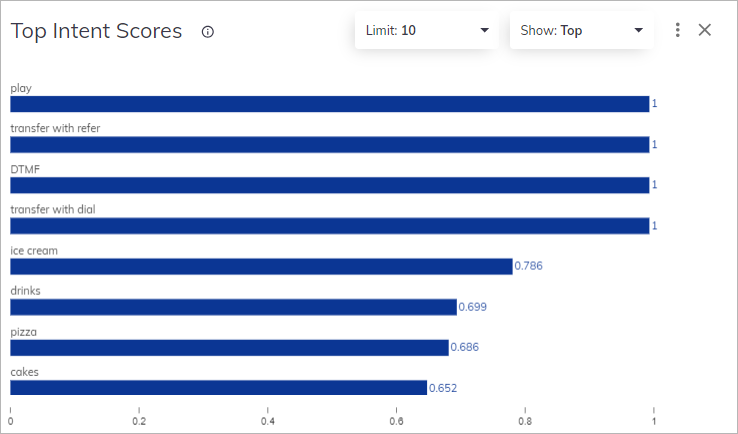
 ### Top Intent Scores
Indicates the top-rated numbers of Intents displayed in a bar chart.
For more information, see [Intent Analyzer](/ai/platform-features/nlu/intents/intent-analyzer).
Source table:
```txt theme={null}
| Intents | Intent Score |
| -------------------- | ------------------ |
| play | 1 |
| transfer with dial | 1 |
| transfer with refer | 1 |
| DTMF | 1 |
| ice cream | 0.7862064089630107 |
| drinks | 0.698537294767418 |
| pizza | 0.6863160928710601 |
| cakes | 0.6517875252045072 |
```
Result:
1. Intent Score Max: `1`
2. Intent Score Min: `0.65`
### Top Intent Scores
Indicates the top-rated numbers of Intents displayed in a bar chart.
For more information, see [Intent Analyzer](/ai/platform-features/nlu/intents/intent-analyzer).
Source table:
```txt theme={null}
| Intents | Intent Score |
| -------------------- | ------------------ |
| play | 1 |
| transfer with dial | 1 |
| transfer with refer | 1 |
| DTMF | 1 |
| ice cream | 0.7862064089630107 |
| drinks | 0.698537294767418 |
| pizza | 0.6863160928710601 |
| cakes | 0.6517875252045072 |
```
Result:
1. Intent Score Max: `1`
2. Intent Score Min: `0.65`
 ## Line charts
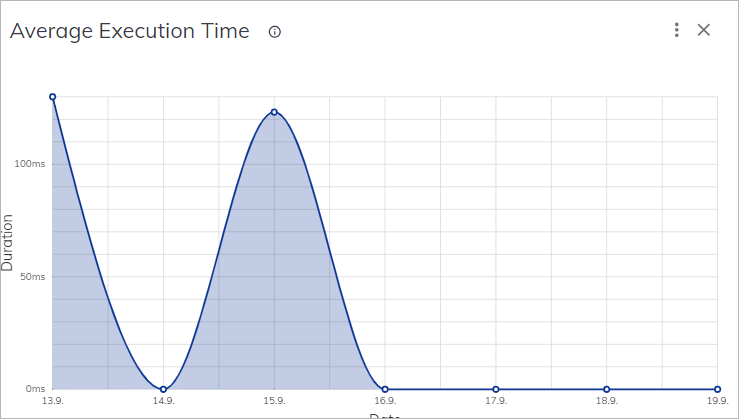
### Average Execution Time
Displays the average time in milliseconds it takes to execute a Flow process over a selected time span.
Formula:
Average Execution Time = `Sum of Execution Times / Total number of inputs`
Source table:
```txt theme={null}
| Date | Execution Time |
| ------------ | --------------- |
| 2023-09-13 | 130 |
| 2023-09-14 | 0 |
| 2023-09-15 | 123 |
| 2023-09-16 | 0 |
| 2023-09-17 | 0 |
| 2023-09-18 | 0 |
| 2023-09-19 | 0 |
```
Result: `(130ms + 123ms) / 2 = 127.5ms`
## Line charts
### Average Execution Time
Displays the average time in milliseconds it takes to execute a Flow process over a selected time span.
Formula:
Average Execution Time = `Sum of Execution Times / Total number of inputs`
Source table:
```txt theme={null}
| Date | Execution Time |
| ------------ | --------------- |
| 2023-09-13 | 130 |
| 2023-09-14 | 0 |
| 2023-09-15 | 123 |
| 2023-09-16 | 0 |
| 2023-09-17 | 0 |
| 2023-09-18 | 0 |
| 2023-09-19 | 0 |
```
Result: `(130ms + 123ms) / 2 = 127.5ms`
 ## Download Report
To download a report as a CSV file for the chart,
click
## Download Report
To download a report as a CSV file for the chart,
click  in the upper-right corner of the chart.
To create a report file, refer to the [Download Report](https://docs.cognigy.com/insights/download-reports/) article.
## More Information
* [Engagement Report](/insights/reports/engagement)
* [Overview Report](/insights/reports/overview)
* [Live Agent Report](/insights/reports/live-agent)
in the upper-right corner of the chart.
To create a report file, refer to the [Download Report](https://docs.cognigy.com/insights/download-reports/) article.
## More Information
* [Engagement Report](/insights/reports/engagement)
* [Overview Report](/insights/reports/overview)
* [Live Agent Report](/insights/reports/live-agent)