> ## Documentation Index
> Fetch the complete documentation index at: https://docs.cognigy.com/llms.txt
> Use this file to discover all available pages before exploring further.
# Overview
Updated in 2025.19
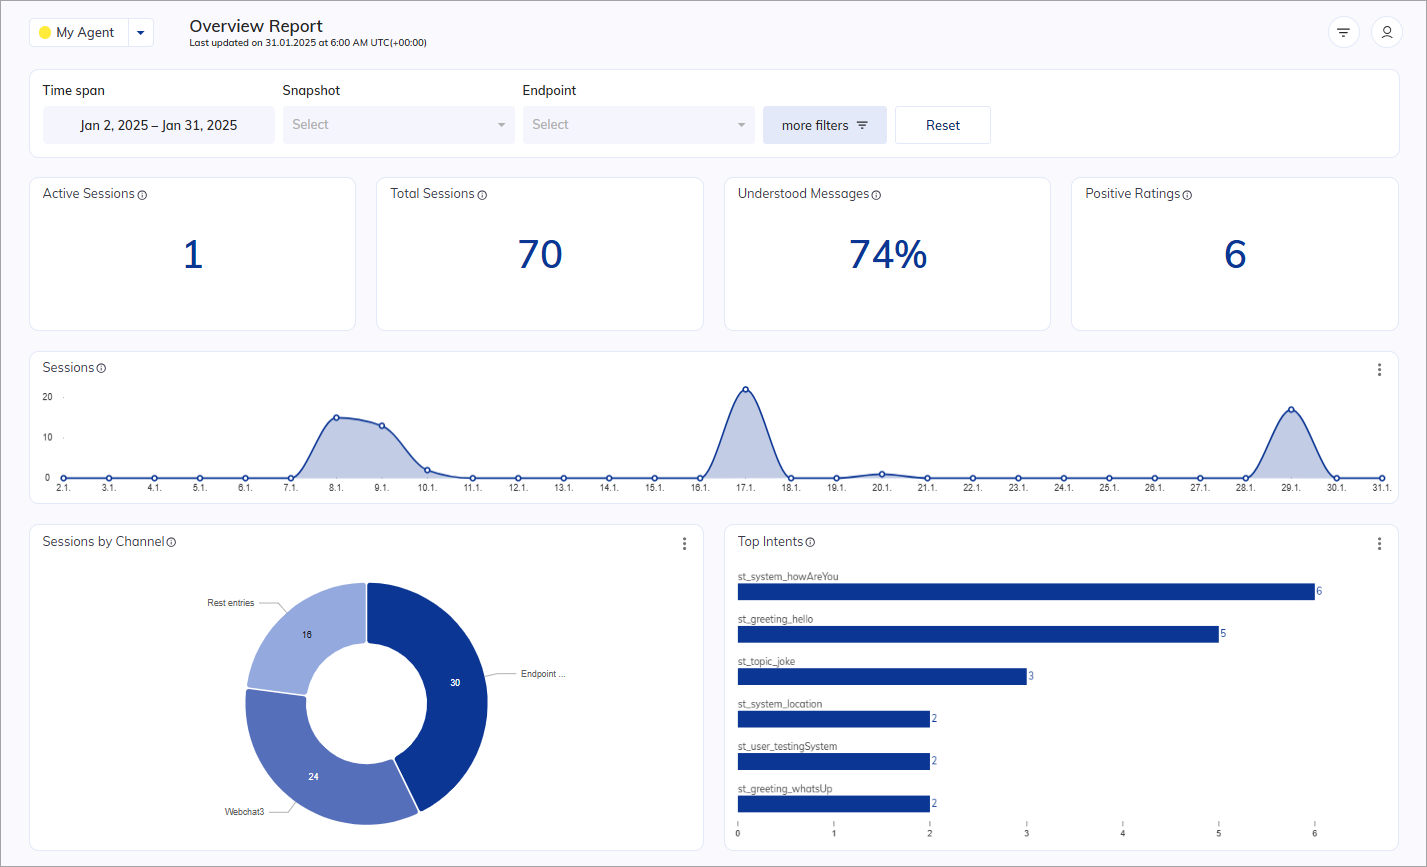
The *Overview Report* gives you a quick summary of how customers are interacting with your AI Agent.
The summary of key metrics is represented in the following charts:
* [Indicators](/insights/reports/engagement#indicators)
* [Bar charts](/insights/reports/engagement#bar-charts)
* [Line charts](/insights/reports/engagement#line-charts)
All charts display data based on the global filter settings you've selected.
 ## Indicators
### Active Sessions
Indicates the total number of currently active user sessions in the last 15 minutes. This widget updates in a regular interval of 30 seconds.
### Total Sessions
Indicates the total number of sessions.
### Positive Ratings
Indicates the total number of Positive Ratings given as feedback by the end user.
Source table:
```txt theme={null}
| Sessions | Positive Rating | Negative Rating | Rated Sessions |
| ----------- | --------------- | --------------- | -------------- |
| session-123 | 1 | 0 | 1 |
| session-456 | 0 | 1 | 1 |
| session-789 | 0 | 0 | 0 |
| session-abc | 1 | 0 | 1 |
| session-def | 1 | 0 | 1 |
| ---------------------------------------------------------------- |
| TOTAL | 3 | 1 | 4 |
```
Result: `3`
## Ring charts
### Sessions by Channel
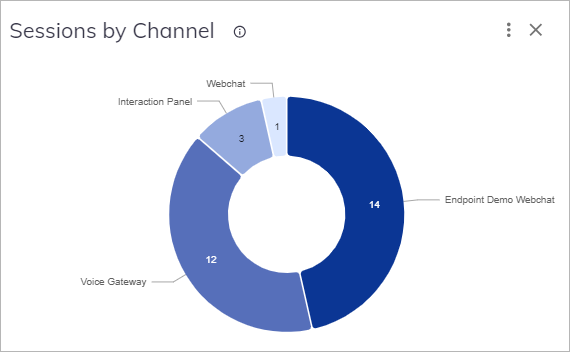
Indicates the total number of conversations displayed in a pie chart based on the channels used.
Source table:
```txt theme={null}
| Sessions | Channel | Conversations | Percentage |
| ----------- | --------------- | --------------- | -------------- |
| session-123 | Demo Webchat | 14 | 46.67 |
| session-456 | Voice Gateway | 12 | 40 |
| session-789 | Interaction Panel| 3 | 10 |
| session-abc | Webchat | 1 | 3.33 |
| ----------------------------------------------------------------- |
| TOTAL | | 30 | 100 |
```
Result:
## Indicators
### Active Sessions
Indicates the total number of currently active user sessions in the last 15 minutes. This widget updates in a regular interval of 30 seconds.
### Total Sessions
Indicates the total number of sessions.
### Positive Ratings
Indicates the total number of Positive Ratings given as feedback by the end user.
Source table:
```txt theme={null}
| Sessions | Positive Rating | Negative Rating | Rated Sessions |
| ----------- | --------------- | --------------- | -------------- |
| session-123 | 1 | 0 | 1 |
| session-456 | 0 | 1 | 1 |
| session-789 | 0 | 0 | 0 |
| session-abc | 1 | 0 | 1 |
| session-def | 1 | 0 | 1 |
| ---------------------------------------------------------------- |
| TOTAL | 3 | 1 | 4 |
```
Result: `3`
## Ring charts
### Sessions by Channel
Indicates the total number of conversations displayed in a pie chart based on the channels used.
Source table:
```txt theme={null}
| Sessions | Channel | Conversations | Percentage |
| ----------- | --------------- | --------------- | -------------- |
| session-123 | Demo Webchat | 14 | 46.67 |
| session-456 | Voice Gateway | 12 | 40 |
| session-789 | Interaction Panel| 3 | 10 |
| session-abc | Webchat | 1 | 3.33 |
| ----------------------------------------------------------------- |
| TOTAL | | 30 | 100 |
```
Result:
 ## Bar charts
### Top Intents
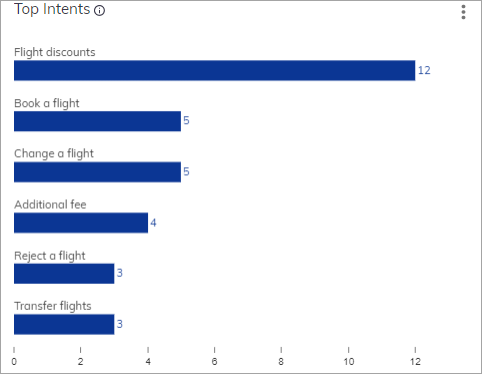
Indicates the top-rated number of used intents, displayed in a horizontal bar chart. The chart showcases the top-rated number of intents used, with a maximum of 6 intents shown in the summary view and 25 in the detailed view. Whenever an intent is matched, it is recorded in the analytics data. The data is then grouped by the matched intent and sorted in descending order.
Source table:
```txt theme={null}
| Intent | Total number |
| ----------------- | ------------- |
| Flight discounts | 12 |
| Book a flight | 5 |
| Change a flight | 5 |
| Additional fee | 4 |
| Reject a flight | 3 |
| Transfer flights | 3 |
```
Result:
## Bar charts
### Top Intents
Indicates the top-rated number of used intents, displayed in a horizontal bar chart. The chart showcases the top-rated number of intents used, with a maximum of 6 intents shown in the summary view and 25 in the detailed view. Whenever an intent is matched, it is recorded in the analytics data. The data is then grouped by the matched intent and sorted in descending order.
Source table:
```txt theme={null}
| Intent | Total number |
| ----------------- | ------------- |
| Flight discounts | 12 |
| Book a flight | 5 |
| Change a flight | 5 |
| Additional fee | 4 |
| Reject a flight | 3 |
| Transfer flights | 3 |
```
Result:
 ### Users by Locale
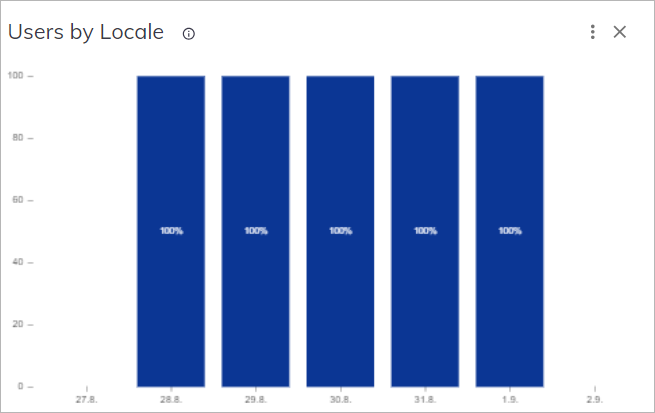
Indicates time-related recognized conversations depending on different locales given in percentages.
Source table:
```txt theme={null}
| Date | Conversations | Locales | Percentage |
| -----------| --------------- | --------------- | --------------- |
| 2023-08-27 | 0 | - | - |
| 2023-08-28 | 1 | "en-US" | 100 |
| 2023-08-29 | 4 | "en-US" | 100 |
| 2023-08-30 | 27 | "en-US" | 100 |
| 2023-08-31 | 1 | "en-US" | 100 |
| 2023-09-01 | 1 | "en-US" | 100 |
| 2023-09-02 | 0 | - | - |
```
Result:
### Users by Locale
Indicates time-related recognized conversations depending on different locales given in percentages.
Source table:
```txt theme={null}
| Date | Conversations | Locales | Percentage |
| -----------| --------------- | --------------- | --------------- |
| 2023-08-27 | 0 | - | - |
| 2023-08-28 | 1 | "en-US" | 100 |
| 2023-08-29 | 4 | "en-US" | 100 |
| 2023-08-30 | 27 | "en-US" | 100 |
| 2023-08-31 | 1 | "en-US" | 100 |
| 2023-09-01 | 1 | "en-US" | 100 |
| 2023-09-02 | 0 | - | - |
```
Result:
 ### Top Tasks
Indicates the top-rated number of tasks reached.
By clicking
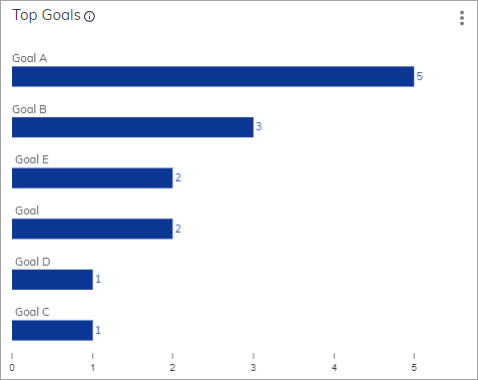
### Top Tasks
Indicates the top-rated number of tasks reached.
By clicking  ,
you can select **Go to Step Explorer**,
which leads you to the Step Explorer in Insights.
Source table:
```txt theme={null}
| Sessions | Tasks |
| ----------- | ---------------------- |
| session-123 | Goal A, Goal B, Goal D |
| session-456 | Goal B, Goal C, Goal E |
| session-789 | Goal A, Goal B, Goal E |
| session-abc | Goal A |
| session-def | Goal, Goal A |
| session-ghi | Goal, Goal A |
```
Result:
,
you can select **Go to Step Explorer**,
which leads you to the Step Explorer in Insights.
Source table:
```txt theme={null}
| Sessions | Tasks |
| ----------- | ---------------------- |
| session-123 | Goal A, Goal B, Goal D |
| session-456 | Goal B, Goal C, Goal E |
| session-789 | Goal A, Goal B, Goal E |
| session-abc | Goal A |
| session-def | Goal, Goal A |
| session-ghi | Goal, Goal A |
```
Result:
 ### Top Slots
Similar to Top Tasks and Top Intents, this chart displays top-rated number of slots displayed in a bar chart.
Source table:
```txt theme={null}
| Slot | Number |
| ----------- | ----------- |
| DATE | 2 |
| NUMBER | 1 |
```
Result:
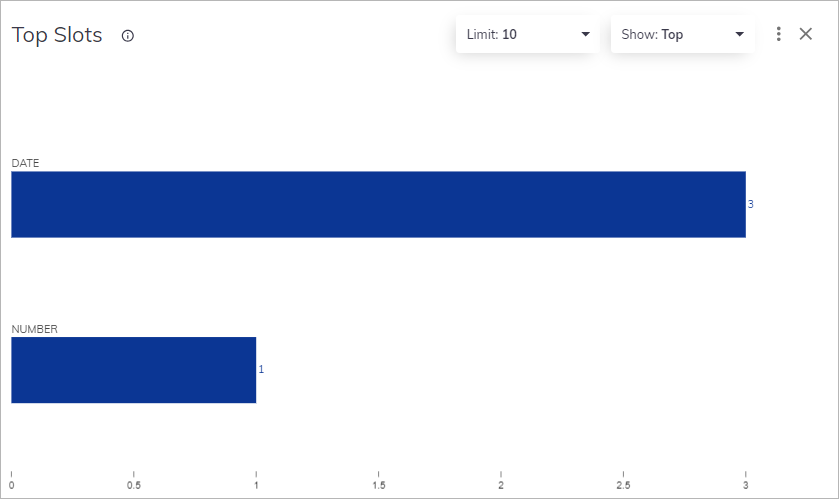
### Top Slots
Similar to Top Tasks and Top Intents, this chart displays top-rated number of slots displayed in a bar chart.
Source table:
```txt theme={null}
| Slot | Number |
| ----------- | ----------- |
| DATE | 2 |
| NUMBER | 1 |
```
Result:
 ### Number of Inputs
Displays the number of inputs displayed over a period of time.
Source table:
```txt theme={null}
| Date | Inputs |
| -----------| ------------ |
| 2023-08-27 | 0 |
| 2023-08-28 | 1 |
| 2023-08-29 | 23 |
| 2023-08-30 | 72 |
| 2023-08-31 | 8 |
| 2023-09-01 | 3 |
| 2023-09-02 | 0 |
```
Result:
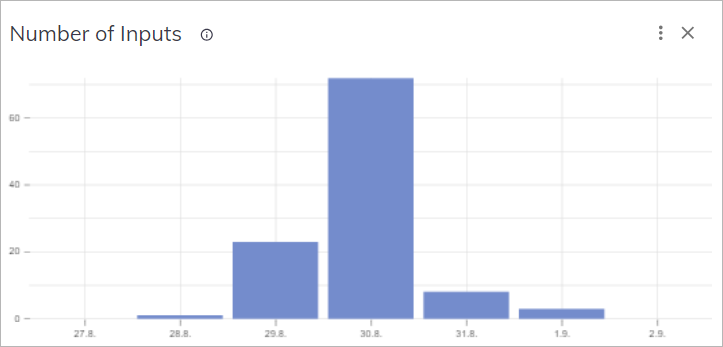
### Number of Inputs
Displays the number of inputs displayed over a period of time.
Source table:
```txt theme={null}
| Date | Inputs |
| -----------| ------------ |
| 2023-08-27 | 0 |
| 2023-08-28 | 1 |
| 2023-08-29 | 23 |
| 2023-08-30 | 72 |
| 2023-08-31 | 8 |
| 2023-09-01 | 3 |
| 2023-09-02 | 0 |
```
Result:
 ## Line charts
### Sessions
Displays the number of sessions on a timescale.
Source table:
```txt theme={null}
| Date | Sessions |
| -----------| ------------ |
| 2023-08-27 | 0 |
| 2023-08-28 | 1 |
| 2023-08-29 | 4 |
| 2023-08-30 | 30 |
| 2023-08-31 | 6 |
| 2023-09-01 | 1 |
| 2023-09-02 | 0 |
```
Result:
## Line charts
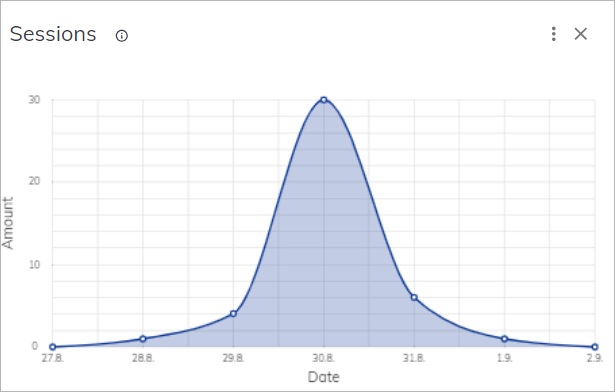
### Sessions
Displays the number of sessions on a timescale.
Source table:
```txt theme={null}
| Date | Sessions |
| -----------| ------------ |
| 2023-08-27 | 0 |
| 2023-08-28 | 1 |
| 2023-08-29 | 4 |
| 2023-08-30 | 30 |
| 2023-08-31 | 6 |
| 2023-09-01 | 1 |
| 2023-09-02 | 0 |
```
Result:
 ### Unique Contacts
Displays the number of unique users (`userid`) over a selected time span. If a user has multiple sessions in a single day, they are counted as one unique contact for that day.
Source table:
```txt theme={null}
| Date | Contacts |
| --------- | -------- |
| 1/16/2023 | 1 |
| 1/17/2023 | 8 |
| 1/18/2023 | 15 |
| 1/19/2023 | 6 |
| 1/20/2023 | 18 |
```
Result:
### Unique Contacts
Displays the number of unique users (`userid`) over a selected time span. If a user has multiple sessions in a single day, they are counted as one unique contact for that day.
Source table:
```txt theme={null}
| Date | Contacts |
| --------- | -------- |
| 1/16/2023 | 1 |
| 1/17/2023 | 8 |
| 1/18/2023 | 15 |
| 1/19/2023 | 6 |
| 1/20/2023 | 18 |
```
Result:
 ## Download Report
To download a report as a CSV file for the chart,
click in the upper-right corner of the chart.
To create a report file, refer to the [Download Report](https://docs.cognigy.com/insights/download-reports/) article.
## More Information
* [Engagement Report](/insights/reports/engagement)
* [NLU Performance Report](/insights/reports/nlu-performance)
* [Live Agent Report](/insights/reports/live-agent)
## Download Report
To download a report as a CSV file for the chart,
click in the upper-right corner of the chart.
To create a report file, refer to the [Download Report](https://docs.cognigy.com/insights/download-reports/) article.
## More Information
* [Engagement Report](/insights/reports/engagement)
* [NLU Performance Report](/insights/reports/nlu-performance)
* [Live Agent Report](/insights/reports/live-agent)