> ## Documentation Index
> Fetch the complete documentation index at: https://docs.cognigy.com/llms.txt
> Use this file to discover all available pages before exploring further.
# Getting Started with AI Ops Center
> Learn how to create an AI Agent, monitor its performance metrics, track errors, and enable alerts in Ops Center.
In this tutorial, you'll create an AI Agent, explore its performance metrics, monitor errors, and enable alerts in Ops Center.
## Prerequisites
* By default, only the Overview page is available for viewing in Ops Center. To get a license and enable full access, contact your Customer Success representative.
* Assign the `admin` or `opsCenterUser` role to the user.
## Create a Flow
1. In the Cognigy.AI interface, go to the Project and create a Flow in it.
2. In the Flow editor, add a Say Node.
3. In the Node editor, enter `You said {{input.text}}` in the **Text** field. Save changes.
## Create an Endpoint
1. In the left-side menu of the Project, go to **Deploy > Endpoints**.
2. On the **Endpoints** page, click **+ New Endpoint**.
3. In the **New Endpoint** section, do the following:
1. Select the **Rest** Endpoint type and give your Endpoint a unique name.
2. Select the previously created Flow from the list. Save changes.
4. In the Endpoint editor, copy the URL from the **Endpoint URL** field.
## Test the Flow
1. For testing purposes, use [Postman](https://web.postman.co/). In the Postman interface, create a `POST` request.
2. Paste the Endpoint URL you copied earlier into the **Request URL** field.
3. In the **Headers** section, enter the `Content-Type` key and its `application/json` value.
4. In the **Body** section, select the **raw** option and ensure the format is set to `JSON`.
5. Copy the following JSON and paste it into the **Body** field:
```json theme={null}
{
"userId": "uniqueUserId",
"sessionId": "uniqueSessionId",
"text": "Hello!",
"channel": "webchat",
"data": {}
}
```
6. Send the request. To send multiple requests in a loop, use the Postman Collection Runner.
7. In the request body, replace the `text` value with the `{{message}}`:
```json theme={null}
{
"userId": "testUser123",
"sessionId": "testSession123",
"text": "{{message}}",
"channel": "webchat"
}
```
Save the request in a Collection.
8. Upload the [CSV](https://docs.cognigy.com/_assets/ops-center/test-dataset.csv) to the Collection Runner and set the iteration count.
9. Click **Run** to send multiple messages in a loop.
## View Metrics
1. In the Cognigy.AI interface, navigate to the Admin Center using one of the following options:
* Click **User Menu > Admin Center** on the **Main** page.
* Select **Admin Center** from the User Menu in the bottom-left corner of the **Project** page.
2. In the left-side menu, click **Ops Center**. The **Overview** dashboard opens by default, where you can monitor key metrics.
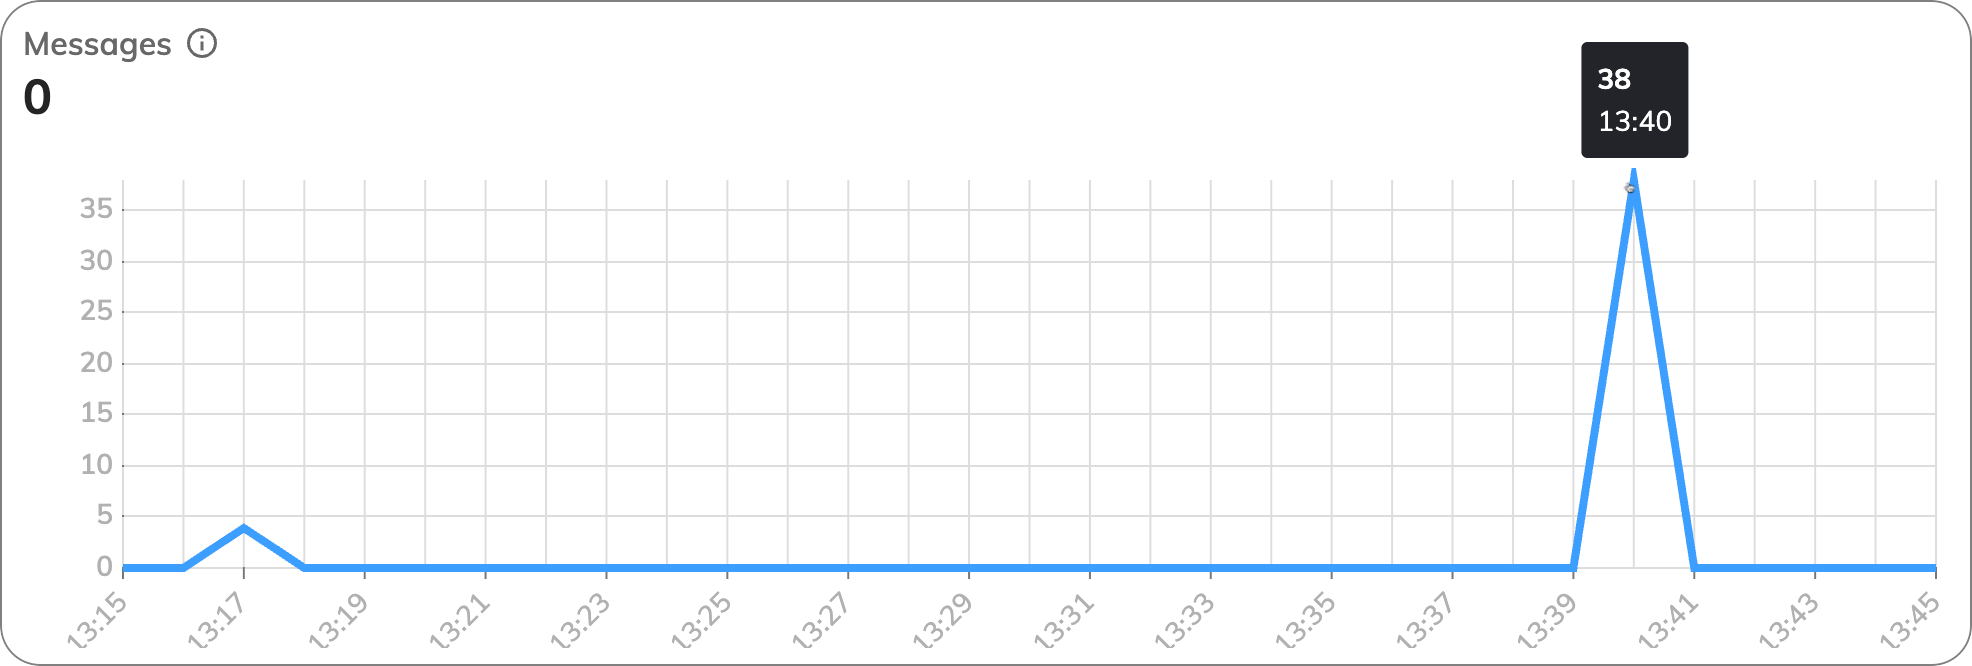
3. Inspect the **Messages** chart. This chart provides insights into user interactions, showing the volume of user inputs sent to the system.
Look at the peak in the chart, which indicates spikes in end-user activity. This information helps identify periods of high engagement, measured by the number of user inputs processed per minute. This metric is useful for tracking the overall system load.
 ### Explore Endpoint Metrics
Next, go to the **Endpoints** tab to view detailed performance metrics for your Endpoints.
Focus on the following charts for insights into Endpoint performance:
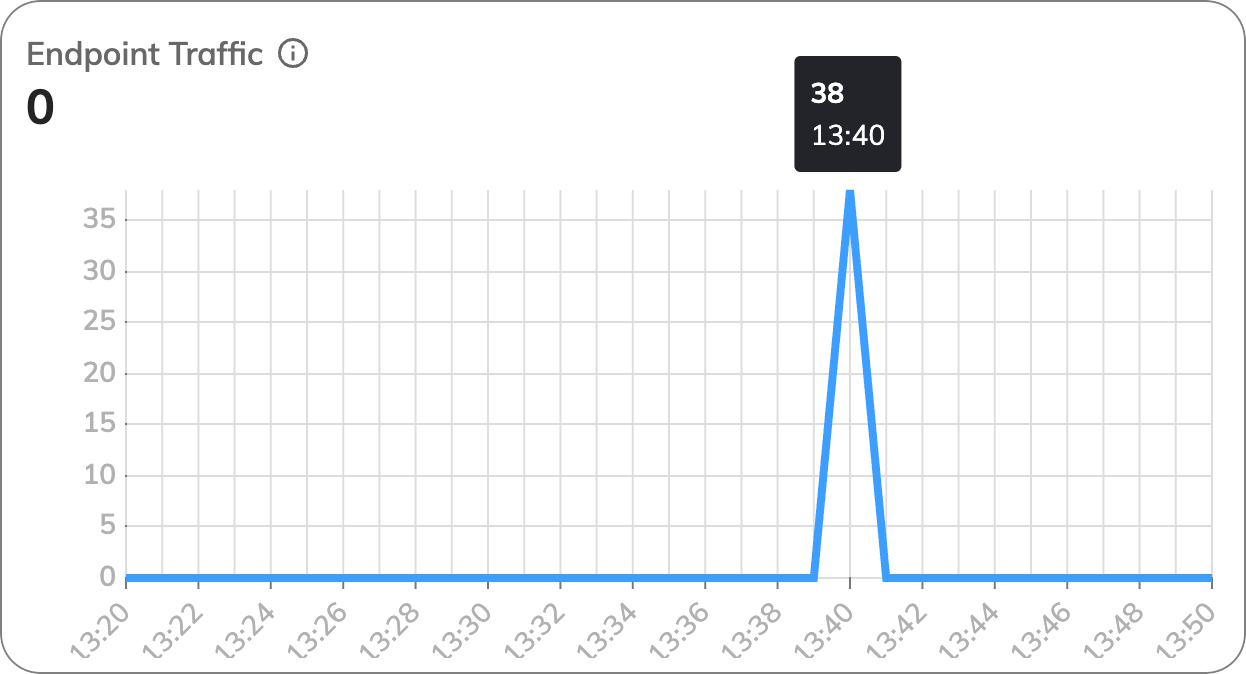
This chart tracks the volume of traffic (requests) handled by each Endpoint. A sudden increase or decrease can indicate changes in system demand or issues with Endpoint availability.
Look at the peak in the chart, which indicates end-user activity in the Endpoints. This means that 38 user inputs were sent through the Endpoints per minute.
### Explore Endpoint Metrics
Next, go to the **Endpoints** tab to view detailed performance metrics for your Endpoints.
Focus on the following charts for insights into Endpoint performance:
This chart tracks the volume of traffic (requests) handled by each Endpoint. A sudden increase or decrease can indicate changes in system demand or issues with Endpoint availability.
Look at the peak in the chart, which indicates end-user activity in the Endpoints. This means that 38 user inputs were sent through the Endpoints per minute.
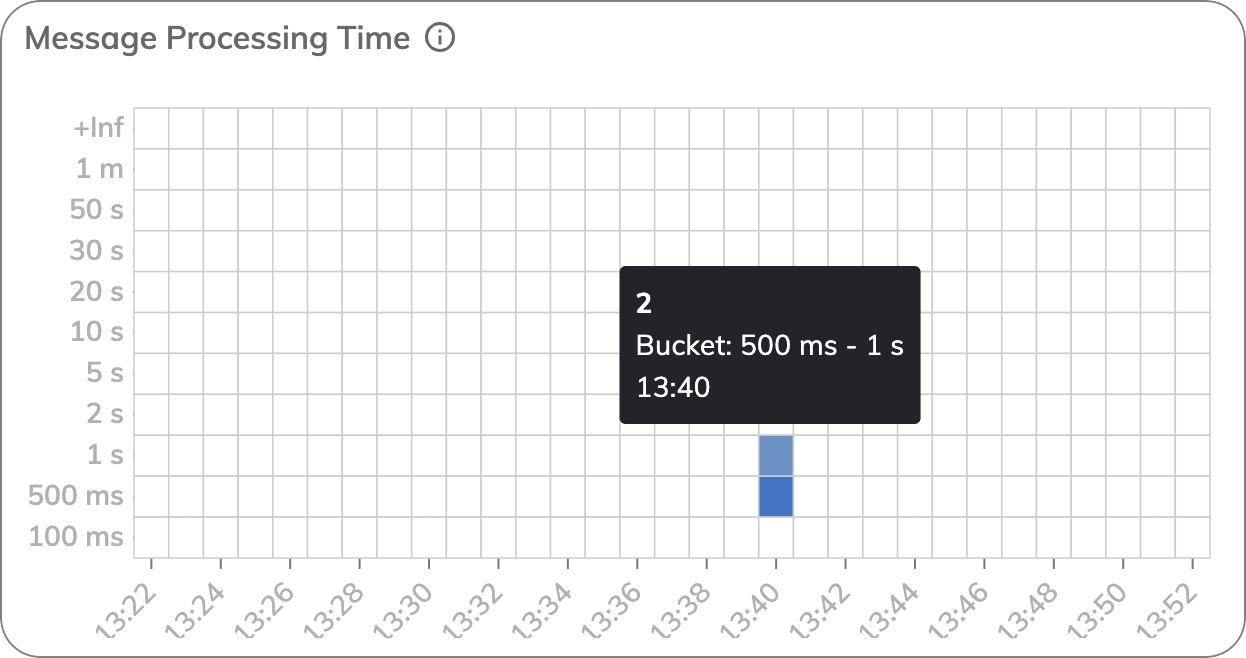
 This chart tracks the time it takes to process each user input at the Endpoint. Monitoring this metric helps identify delays in message handling, potentially pointing to performance bottlenecks in your Flows or external services.
The chart shows that at 9:03, there were 38 user inputs with processing times falling within the 100–500 millisecond time range.
This chart tracks the time it takes to process each user input at the Endpoint. Monitoring this metric helps identify delays in message handling, potentially pointing to performance bottlenecks in your Flows or external services.
The chart shows that at 9:03, there were 38 user inputs with processing times falling within the 100–500 millisecond time range.
 ### Explore Flow Performance Metrics
After examining the Endpoints, go to the **Flows** tab to analyze how your Flows are performing in terms of execution and natural language understanding.
Pay attention to the following charts:
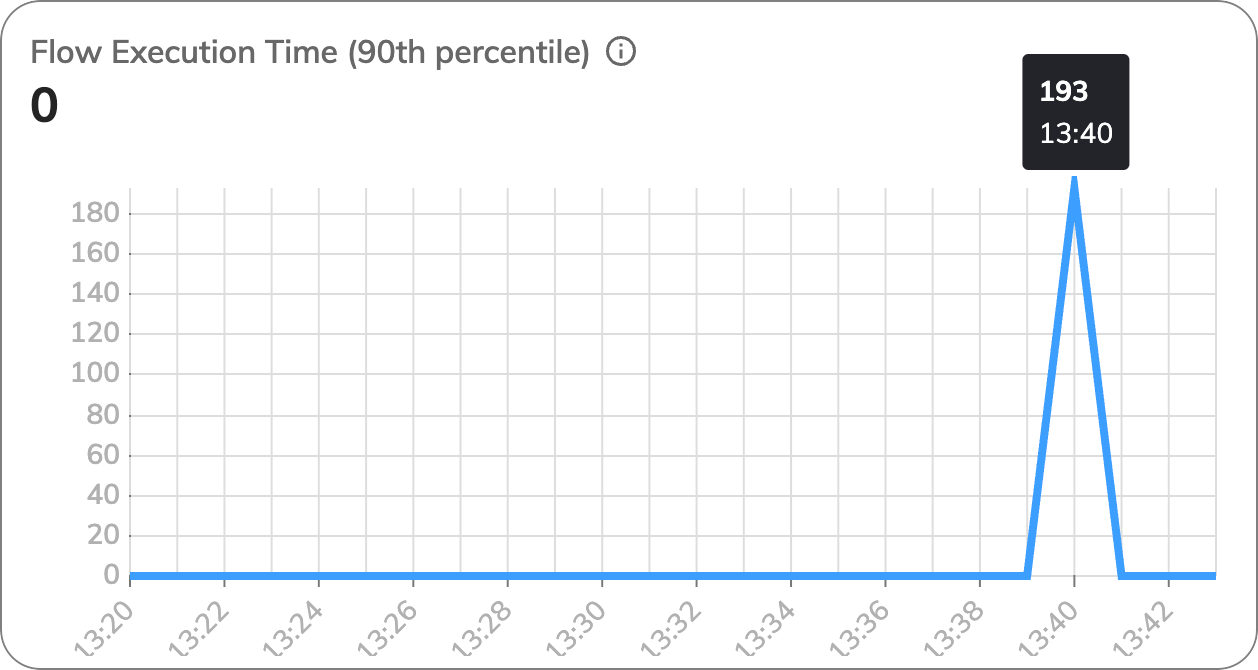
This chart shows the distribution of Flow execution times, focusing on the 90th percentile. The 90th percentile indicates the time below which 90% of your Flows finish. In this case, the 90th percentile is 193 milliseconds (ms), meaning 90% of Flows completed in 193 ms or less, which suggests good performance.
### Explore Flow Performance Metrics
After examining the Endpoints, go to the **Flows** tab to analyze how your Flows are performing in terms of execution and natural language understanding.
Pay attention to the following charts:
This chart shows the distribution of Flow execution times, focusing on the 90th percentile. The 90th percentile indicates the time below which 90% of your Flows finish. In this case, the 90th percentile is 193 milliseconds (ms), meaning 90% of Flows completed in 193 ms or less, which suggests good performance.
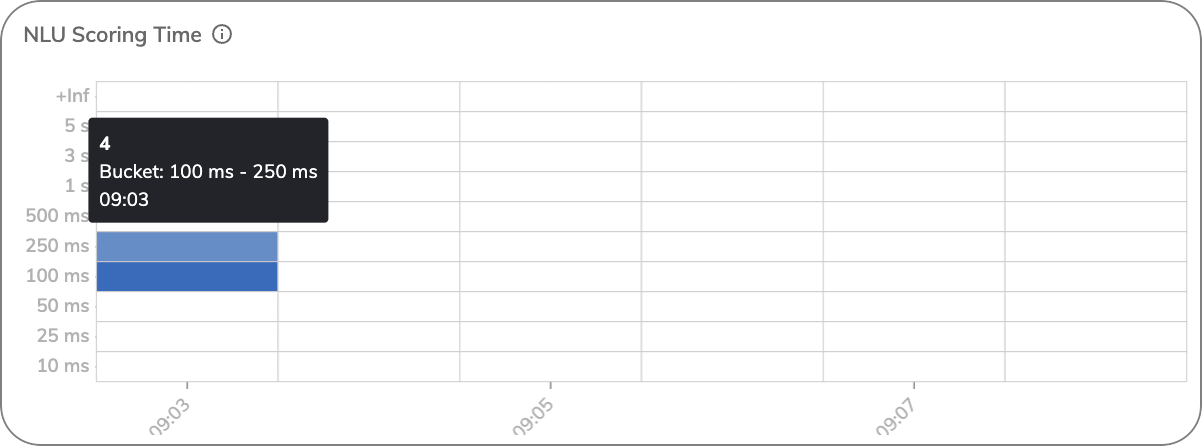
 This chart tracks the time taken by the Natural Language Understanding (NLU) component to score user inputs. Longer scoring times may indicate that the NLU model is struggling to process certain inputs efficiently, potentially due to complex queries or system load.
The chart shows that at 9:03, there were 28 user inputs with scoring times falling within the 50–100 millisecond time range.
This chart tracks the time taken by the Natural Language Understanding (NLU) component to score user inputs. Longer scoring times may indicate that the NLU model is struggling to process certain inputs efficiently, potentially due to complex queries or system load.
The chart shows that at 9:03, there were 28 user inputs with scoring times falling within the 50–100 millisecond time range.
 ## Manage Alerts
1. In the Ops Center interface, go to the **Overview** dashboard to set up alerts.
2. Select the **Alerts** tab and click **Manage Alerts** to customize your alert preferences.
3. On the **Alerts** tab, activate the **HighMessageVolume** alert, which triggers when message volume exceeds a set threshold.
4. On the **Notification** tab, set up notifications by adding your email address, ensuring you are notified when the alert is triggered. Apply changes.
5. Go to the Postman Collection Runner and send multiple messages in a loop to increase the load on the server. If the system is receiving 50% more messages in the current 5-minute interval compared to the previous one, an alert will appear in the **Overview** dashboard. Also, a notification will be sent to the specified email.
## What's Next?
* Learn the [key concepts](/ops-center/concepts) of Ops Center.
* Familiarize yourself with the [specific metrics](/ops-center/monitor/metrics/overview) for each service.
## Manage Alerts
1. In the Ops Center interface, go to the **Overview** dashboard to set up alerts.
2. Select the **Alerts** tab and click **Manage Alerts** to customize your alert preferences.
3. On the **Alerts** tab, activate the **HighMessageVolume** alert, which triggers when message volume exceeds a set threshold.
4. On the **Notification** tab, set up notifications by adding your email address, ensuring you are notified when the alert is triggered. Apply changes.
5. Go to the Postman Collection Runner and send multiple messages in a loop to increase the load on the server. If the system is receiving 50% more messages in the current 5-minute interval compared to the previous one, an alert will appear in the **Overview** dashboard. Also, a notification will be sent to the specified email.
## What's Next?
* Learn the [key concepts](/ops-center/concepts) of Ops Center.
* Familiarize yourself with the [specific metrics](/ops-center/monitor/metrics/overview) for each service.