> ## Documentation Index
> Fetch the complete documentation index at: https://docs.cognigy.com/llms.txt
> Use this file to discover all available pages before exploring further.
# Alerts
> Learn about the alerts available in Ops Center to monitor the performance and reliability of your Cognigy.AI system.
You can enable alerts for all components.
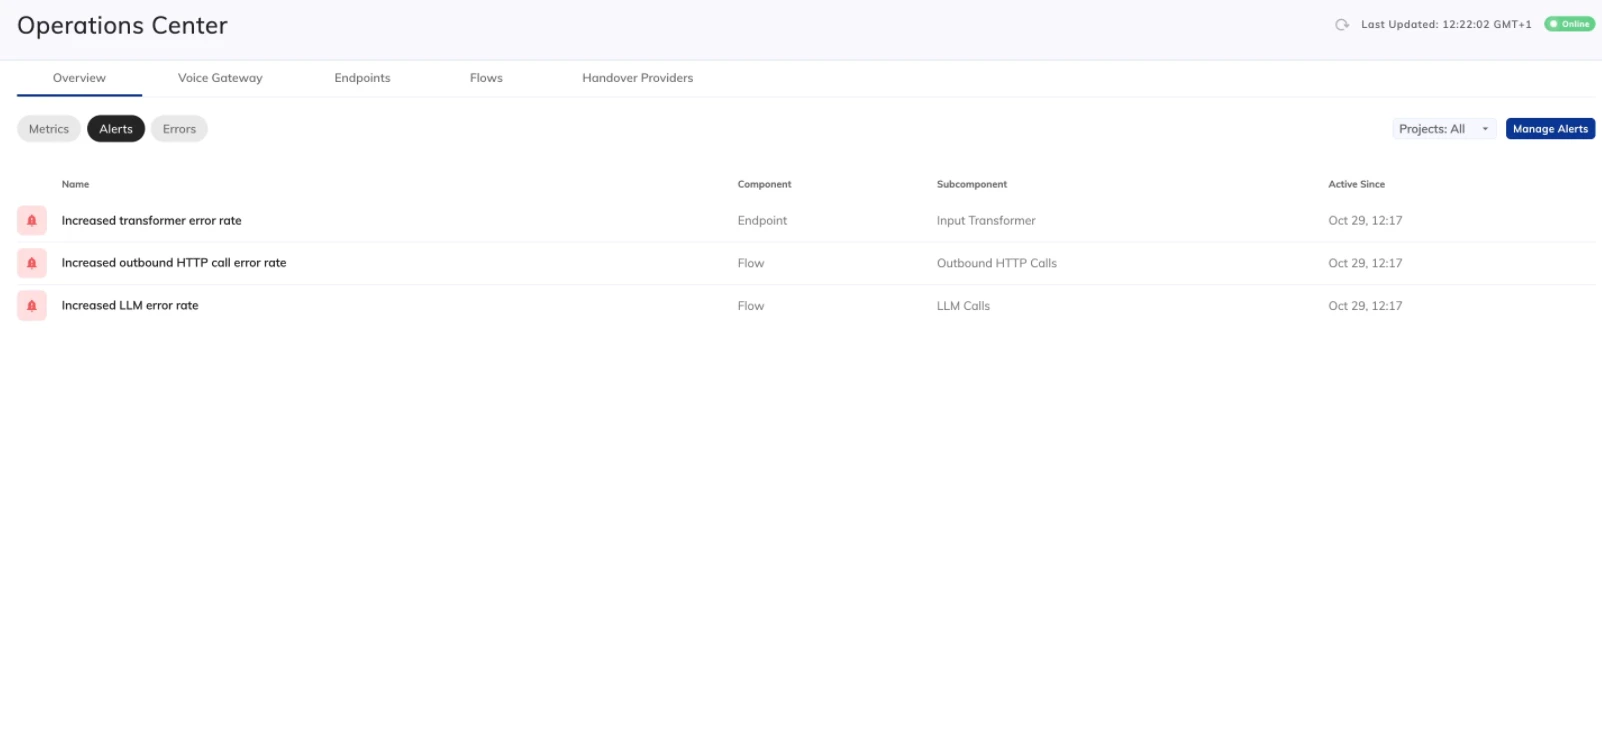 In Ops Center, the following alerts are available:
| **Alert** | **Description** | **Severity** | **Recommended Action** |
| ------------------------------------------ | -------------------------------------------------------------------------------------------------------------------------------------------------------------------------------------- | --------------------------------------------------------------------- | ------------------------------------------------------------------------------------------------------------------------------------------------------------------------------------------------------------------------------------------------------------------------------------------------------------------------------------------------------------------------------------------------------------------------------------------------------------------------------------------------------------------------------------------------------------------------------------------------------------------------------------------------------------- |
| Sudden message volume increase | The system is receiving 50% more messages in the current 5-minute time interval compared to the previous 5-minute time interval. | Potential system strain during peak usage. | Open the [Messages](/ops-center/monitor/metrics/overview) chart on the **Overview** dashboard and the [Endpoints](/ops-center/monitor/metrics/endpoints) dashboard to view the Endpoint traffic. Monitor system load, Flow latency, and ensure performance remains stable. |
| Sudden message volume decrease | The system is receiving 95% fewer messages in the current 5-minute interval compared to the previous 5-minute interval. | Possible downtime, channel issue, or low traffic. | Open the [Messages](/ops-center/monitor/metrics/overview) chart on the **Overview** dashboard and the [Endpoints](/ops-center/monitor/metrics/endpoints) dashboard to view the Endpoint traffic. Review the [logs](/ai/agents/test/logs), check Endpoint settings, integrations with third-party platforms, and traffic sources. |
| Increased transformer error rate | The number of errors thrown by the Endpoint Transformers has exceeded 100 in the last 5 minutes. | Message transformations may fail or degrade in quality. | Open the [Endpoints](/ops-center/monitor/metrics/endpoints) dashboard to view transformer metrics. Review the [logs](/ai/agents/test/logs) and verify the Transformer settings in Endpoints. |
| Increased outbound HTTP call error rate | The number of errors thrown by API calls made through the HTTP Request Node has exceeded 50 in the last 5 minutes. | Data loss, delayed Flows, or unavailable functionality for end users. | Open the [Flows](/ops-center/monitor/metrics/flows) dashboard to view outbound HTTP request metrics. Review the [logs](/ai/agents/test/logs), verify the HTTP Request Node configurations in your Flows and the availability of the external service's API. |
| Increased LLM error rate | The number of errors thrown during Large Language Model prompt execution has exceeded 100 in the last 5 minutes. Error count includes automatic retries (up to 3 attempts per prompt). | Failed executions may affect response quality. | Open the [Flows](/ops-center/monitor/metrics/flows) dashboard to view outbound LLM-related metrics. Review models configured for LLM-based Flows. Common issues include:
In Ops Center, the following alerts are available:
| **Alert** | **Description** | **Severity** | **Recommended Action** |
| ------------------------------------------ | -------------------------------------------------------------------------------------------------------------------------------------------------------------------------------------- | --------------------------------------------------------------------- | ------------------------------------------------------------------------------------------------------------------------------------------------------------------------------------------------------------------------------------------------------------------------------------------------------------------------------------------------------------------------------------------------------------------------------------------------------------------------------------------------------------------------------------------------------------------------------------------------------------------------------------------------------------- |
| Sudden message volume increase | The system is receiving 50% more messages in the current 5-minute time interval compared to the previous 5-minute time interval. | Potential system strain during peak usage. | Open the [Messages](/ops-center/monitor/metrics/overview) chart on the **Overview** dashboard and the [Endpoints](/ops-center/monitor/metrics/endpoints) dashboard to view the Endpoint traffic. Monitor system load, Flow latency, and ensure performance remains stable. |
| Sudden message volume decrease | The system is receiving 95% fewer messages in the current 5-minute interval compared to the previous 5-minute interval. | Possible downtime, channel issue, or low traffic. | Open the [Messages](/ops-center/monitor/metrics/overview) chart on the **Overview** dashboard and the [Endpoints](/ops-center/monitor/metrics/endpoints) dashboard to view the Endpoint traffic. Review the [logs](/ai/agents/test/logs), check Endpoint settings, integrations with third-party platforms, and traffic sources. |
| Increased transformer error rate | The number of errors thrown by the Endpoint Transformers has exceeded 100 in the last 5 minutes. | Message transformations may fail or degrade in quality. | Open the [Endpoints](/ops-center/monitor/metrics/endpoints) dashboard to view transformer metrics. Review the [logs](/ai/agents/test/logs) and verify the Transformer settings in Endpoints. |
| Increased outbound HTTP call error rate | The number of errors thrown by API calls made through the HTTP Request Node has exceeded 50 in the last 5 minutes. | Data loss, delayed Flows, or unavailable functionality for end users. | Open the [Flows](/ops-center/monitor/metrics/flows) dashboard to view outbound HTTP request metrics. Review the [logs](/ai/agents/test/logs), verify the HTTP Request Node configurations in your Flows and the availability of the external service's API. |
| Increased LLM error rate | The number of errors thrown during Large Language Model prompt execution has exceeded 100 in the last 5 minutes. Error count includes automatic retries (up to 3 attempts per prompt). | Failed executions may affect response quality. | Open the [Flows](/ops-center/monitor/metrics/flows) dashboard to view outbound LLM-related metrics. Review models configured for LLM-based Flows. Common issues include: - **LLM configuration issues** – adjust the LLM settings if misconfiguration is evident in the logs or error messages.
- **Rate limiting by the LLM provider** – contact the LLM provider to verify usage limits or quota issues.
If the issue can't be resolved, contact Cognigy Product Support for further investigation. |
| Increased Knowledge AI query error rate | The number of failed knowledge search operations has exceeded 100 in the last 5 minutes. | Knowledge retrieval may fail. | Open the [Flows](/ops-center/monitor/metrics/flows) dashboard to view Knowledge AI metrics. Check the embedding model configured for the Knowledge AI feature. Common issues include: - **Rate limiting by the LLM provider** – check logs for details. If you are using an on-premises installation, inspect logs for `service-search-orchestrator`. For SaaS installations, contact Cognigy technical support.
- **Invalid LLM credentials** – use the **Test** button in the LLM resource to verify credentials.
- **Cognigy.AI internal communication issues** – contact Cognigy technical support for further investigation.
|
| Increased real-time translation error rate | The number of real-time translation errors has exceeded 100 in the last 5 minutes. | Translations may fail. | Check connections to translation providers:- **At the project level** – verify credentials, use the **Test** button in **Manage > Settings** of your Projects.
- **At the Endpoint level** – go to the Real-Time Translation settings in Endpoints. For some providers, such as DeepL Translate Pro, ensure you enter the correct values for fields like Formality or Glossary ID.
|
| Increased NLU error rate | The number of failed NLU processing operations has exceeded 100 in the last 5 minutes. | Intent recognition may fail. | Open the [Flows](/ops-center/monitor/metrics/flows) dashboard to view NLU metrics. Review the [logs](/ai/agents/test/logs), verify the [Intent rules](/ai/platform-features/nlu/intents/rules) and [conditions](/ai/platform-features/nlu/intents/conditions), and check your NLU connector, if you have an external NLU connector. If the issue can't be resolved, contact [Cognigy Product Support](/help/get-help) for further investigation. |
| Increased handover error rate | The number of failed handover requests has exceeded 20 in the last 5 minutes. | Handover to human agents may fail. | Open the [Handover Providers](/ops-center/monitor/metrics/handover-providers) dashboard to view handover metrics. Review the [logs](/ai/agents/test/logs), verify the setup of your [handover provider](/ai/escalate/handovers), and check your handover provider's website for any issues with their services. If the issue can't be resolved, contact [Cognigy Product Support](/help/get-help) and provide them the [error log](/ai/agents/test/logs) for further investigation. |
## More Information
* [All Metrics](/ops-center/monitor/metrics/overview)