This report’s metrics include sessions with personal data masked using the Delete Profile or Deactivate Profile Nodes.
Indicators
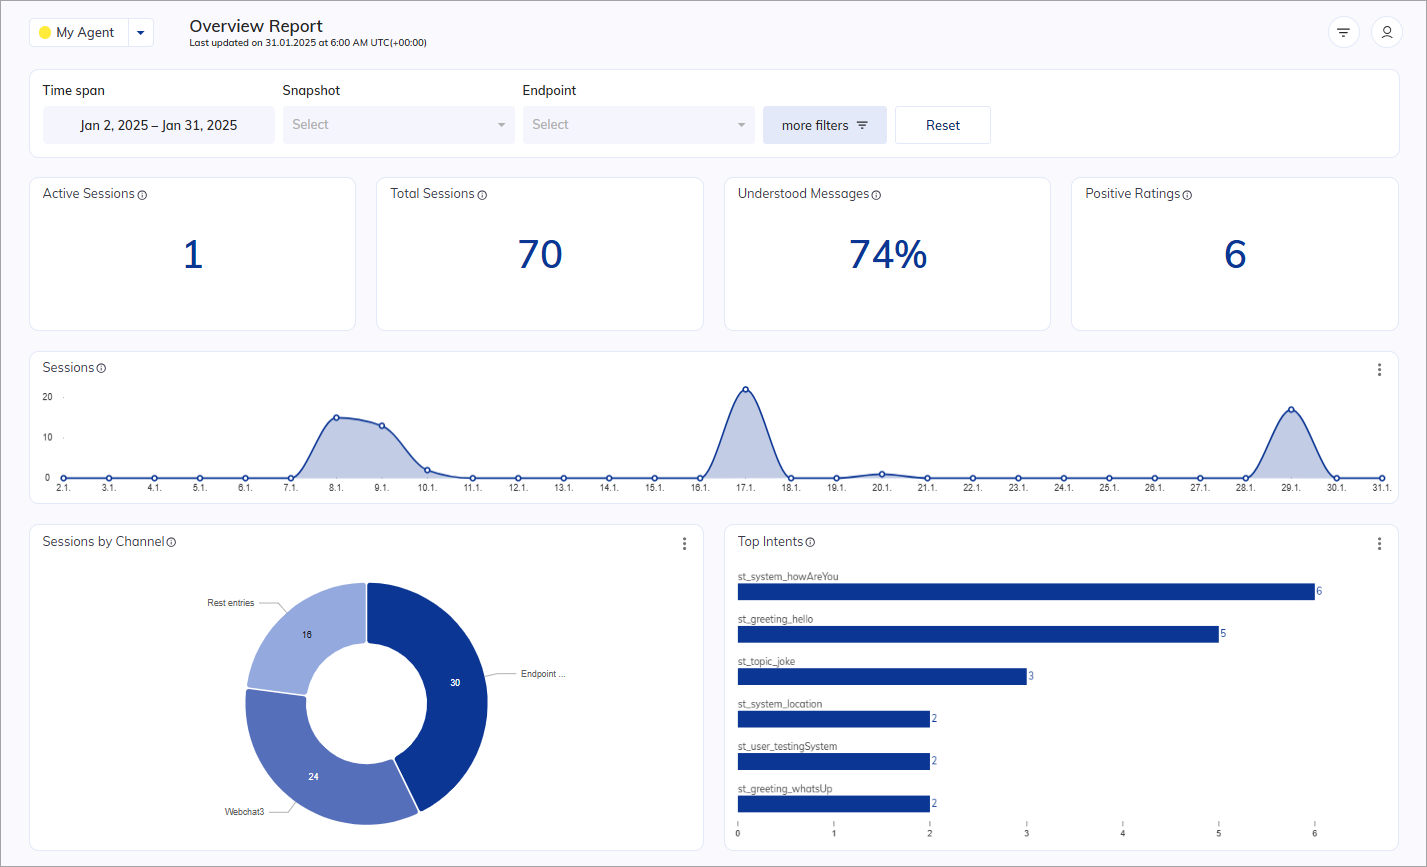
Active Sessions
Indicates the total number of currently active user sessions in the last 15 minutes. This widget updates in a regular interval of 30 seconds.Total Sessions
Indicates the total number of sessions.Positive Ratings
Indicates the total number of Positive Ratings given as feedback by the end user. Source table:3
Ring charts
Sessions by Channel
Indicates the total number of conversations displayed in a pie chart based on the channels used. Source table: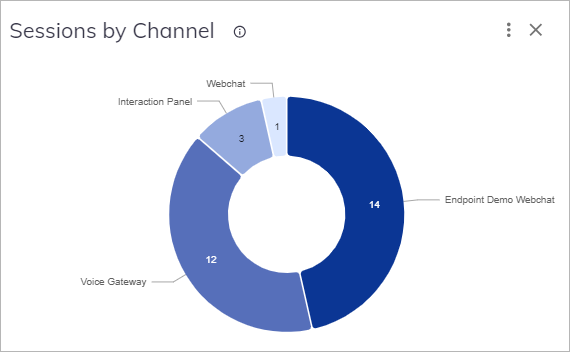
Bar charts
Top Intents
Indicates the top-rated number of used intents, displayed in a horizontal bar chart. The chart showcases the top-rated number of intents used, with a maximum of 6 intents shown in the summary view and 25 in the detailed view. Whenever an intent is matched, it is recorded in the analytics data. The data is then grouped by the matched intent and sorted in descending order. Source table: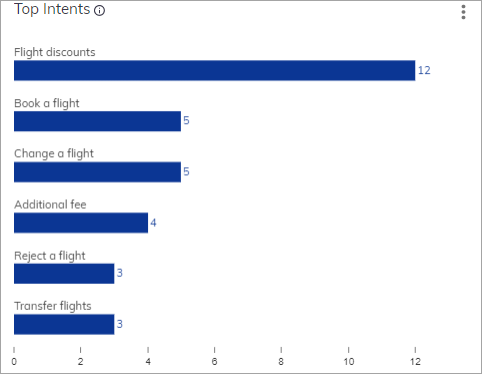
Users by Locale
Indicates time-related recognized conversations depending on different locales given in percentages. Source table: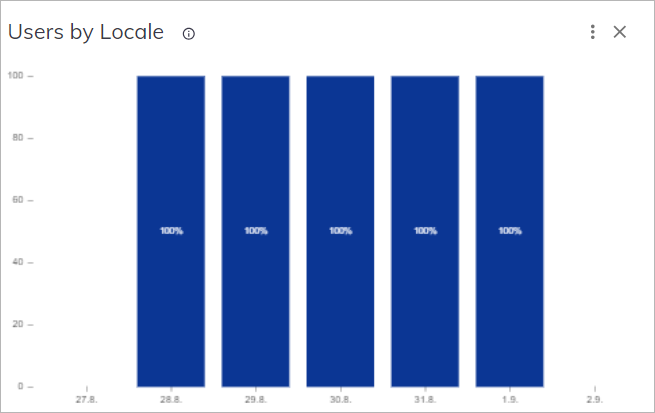
Top Tasks
Indicates the top-rated number of tasks reached. By clicking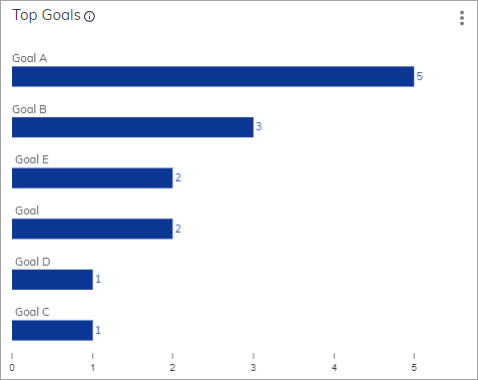
Top Slots
Similar to Top Tasks and Top Intents, this chart displays top-rated number of slots displayed in a bar chart. Source table: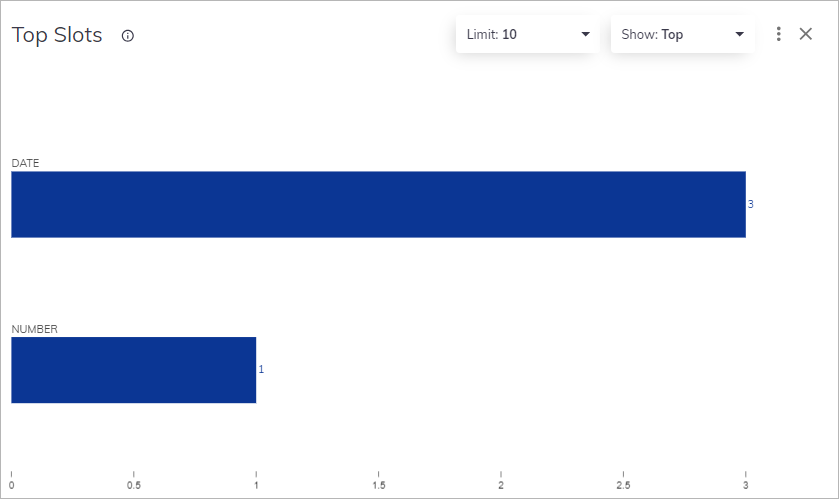
Number of Inputs
Displays the number of inputs displayed over a period of time. Source table: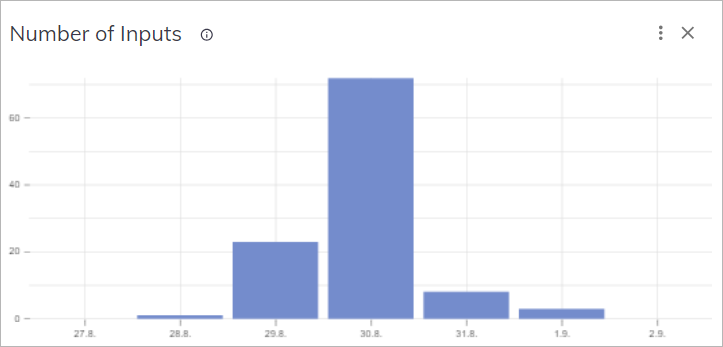
Line charts
Sessions
Displays the number of sessions on a timescale. Source table: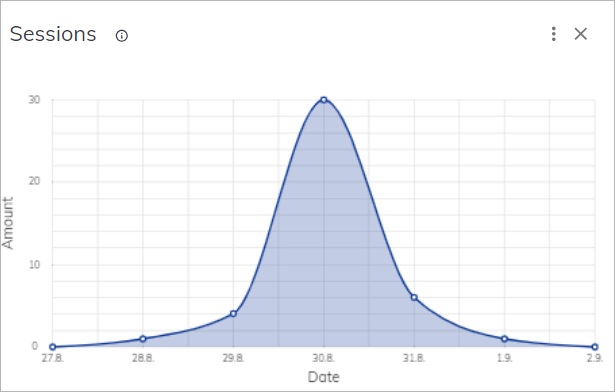
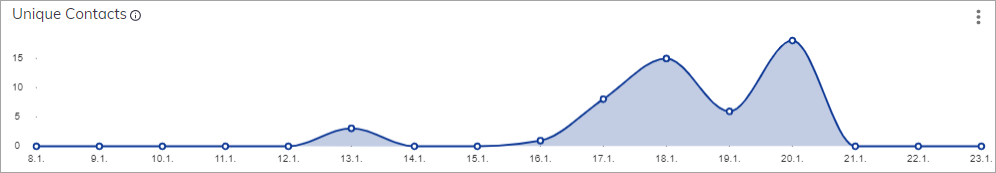
Unique Contacts
Displays the number of unique users (userid) over a selected time span. If a user has multiple sessions in a single day, they are counted as one unique contact for that day.
Source table: