This report’s metrics include sessions with personal data masked using the Delete Profile or Deactivate Profile Nodes.
Indicators
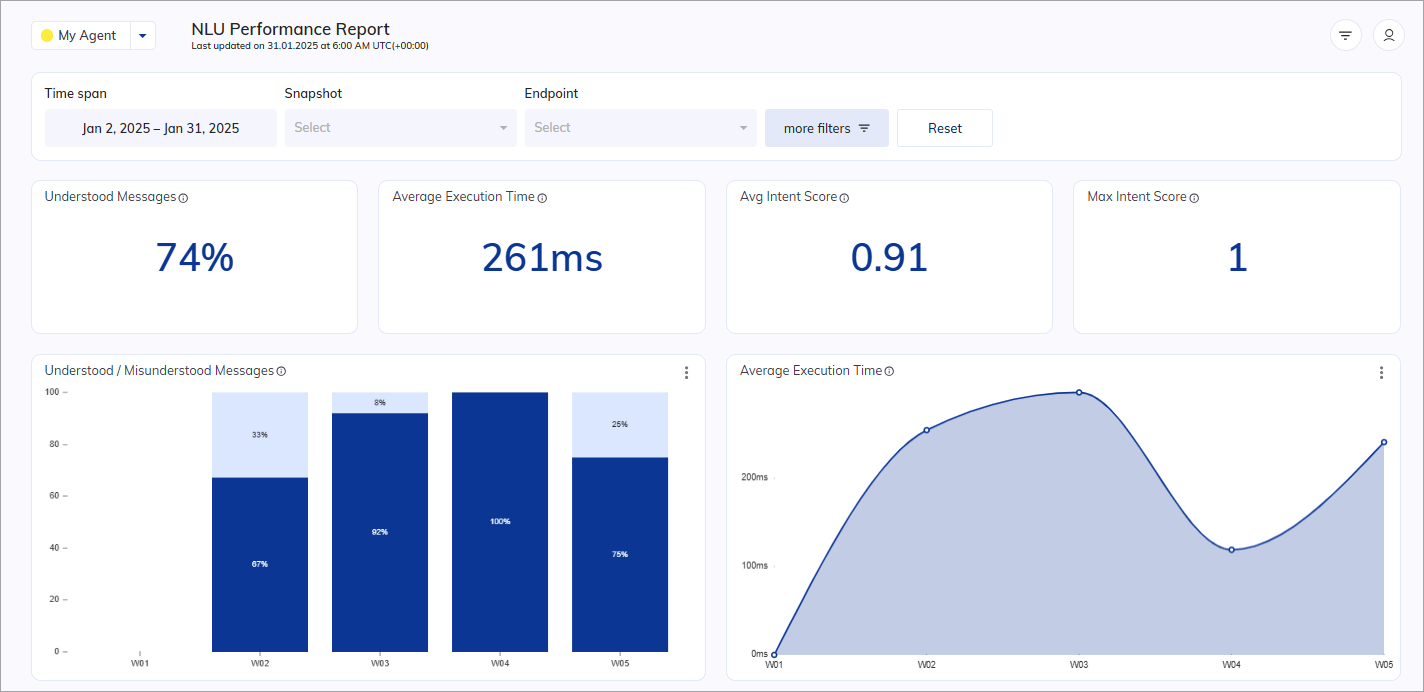
The Indicator charts present real-time data that refreshes every 30 seconds.Average Execution Time
Displays the average execution time across a specific timespan. Formula: Average Execution Time =Sum of Execution Times / Total number of inputs
Avg Intent Score
Displays the average Intent score for the selected time span. Higher Intent scores indicate better AI Agent performance in matching user queries. For more information, see Machine Learning Intents. To find the average intent score, Insights sums up all the intent scores and divides the sum by the total number of records. Source table:- Sum of Intent Scores =
0.30 + 0.90 + 0.10 + 1 + 0.20 + 0.02 + 0.50 = 3.02 - Number of Records =
7 - Average Intent Score =
(Sum of Intent Scores) / (Number of Records) - Average Intent Score =
3.02 / 7
0.43
Max Intent Score
Indicates the number of Intents that were matched with 100% efficacy. Source table:1, so the max intent score is 1.
Bar charts
Top Intents
Displays the top-rated number of Intents. The summary view shows a maximum of 6 Intents, while the detailed view displays up to 25. Matching an Intent triggers its recording in the analytics data. The data is then grouped by the matched Intent and sorted in descending order. Source table: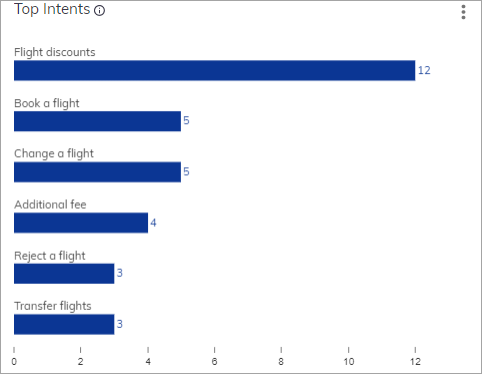
Top Slots
Similar to Top Tasks and Top Intents, this chart displays top-rated number of slots in a horizontal bar chart. Source table: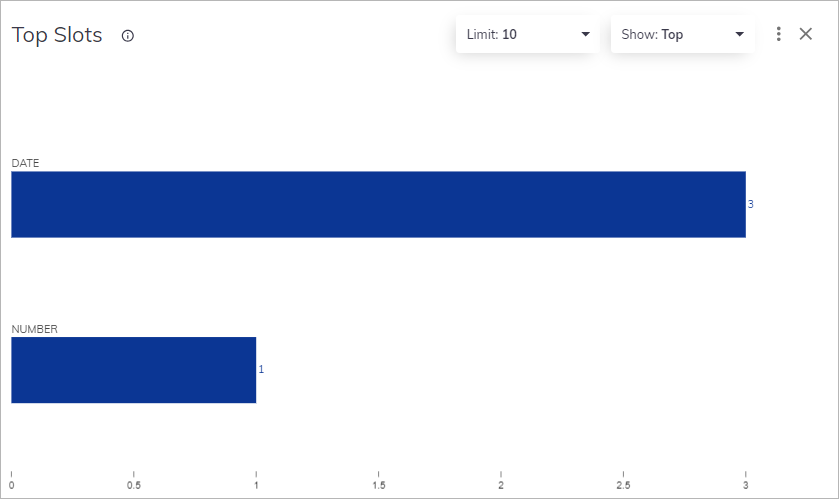
Intents by Score Range
Displays the scoring range of matched Intents. Each score range is displayed as a bar with minimum, maximum, and average values. Clicking on the three-dots menu item, you can select the Go to Intent Trainer that leads you to the application in Cognigy.AI to improve your Flow. For more information, see Intent Trainer. Source table: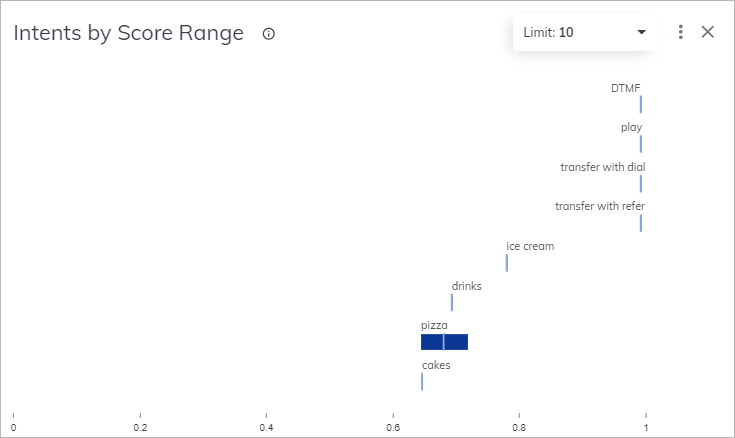
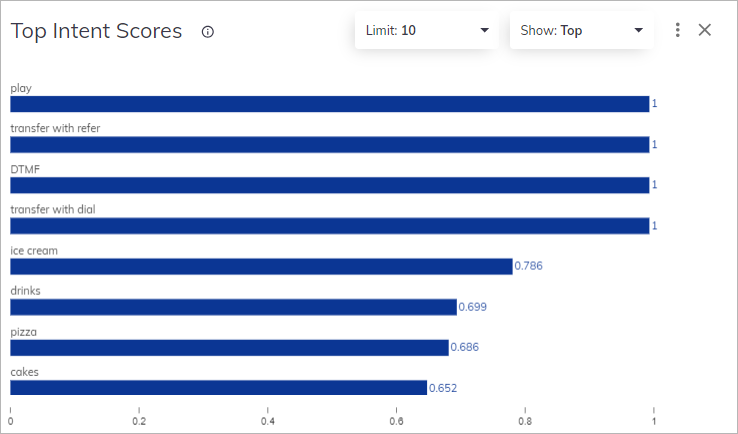
Top Intent Scores
Indicates the top-rated numbers of Intents displayed in a bar chart. For more information, see Intent Analyzer. Source table:- Intent Score Max:
1 - Intent Score Min:
0.65
Line charts
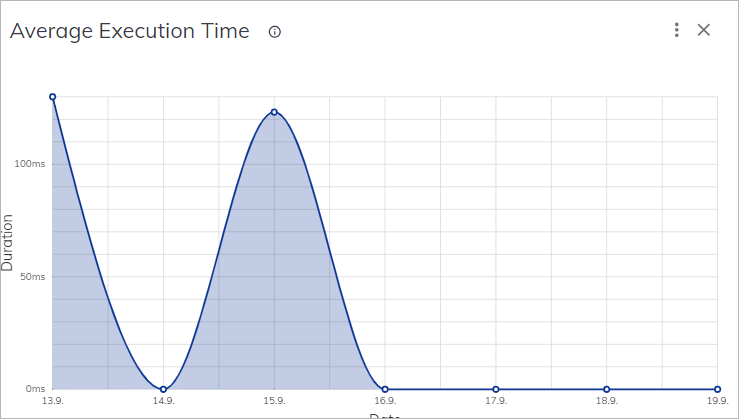
Average Execution Time
Displays the average time in milliseconds it takes to execute a Flow process over a selected time span. Formula: Average Execution Time =Sum of Execution Times / Total number of inputs
Source table:
(130ms + 123ms) / 2 = 127.5ms