The Goals Report is in beta and is available if you have migrated to the new Insights framework.
Before migration, you can also explore the Goals Report in the Cognigy trial environment.
We encourage you to try this feature out and provide us with feedback.
This report’s metrics include sessions with personal data masked using the Delete Profile or Deactivate Profile Nodes.
Indicators
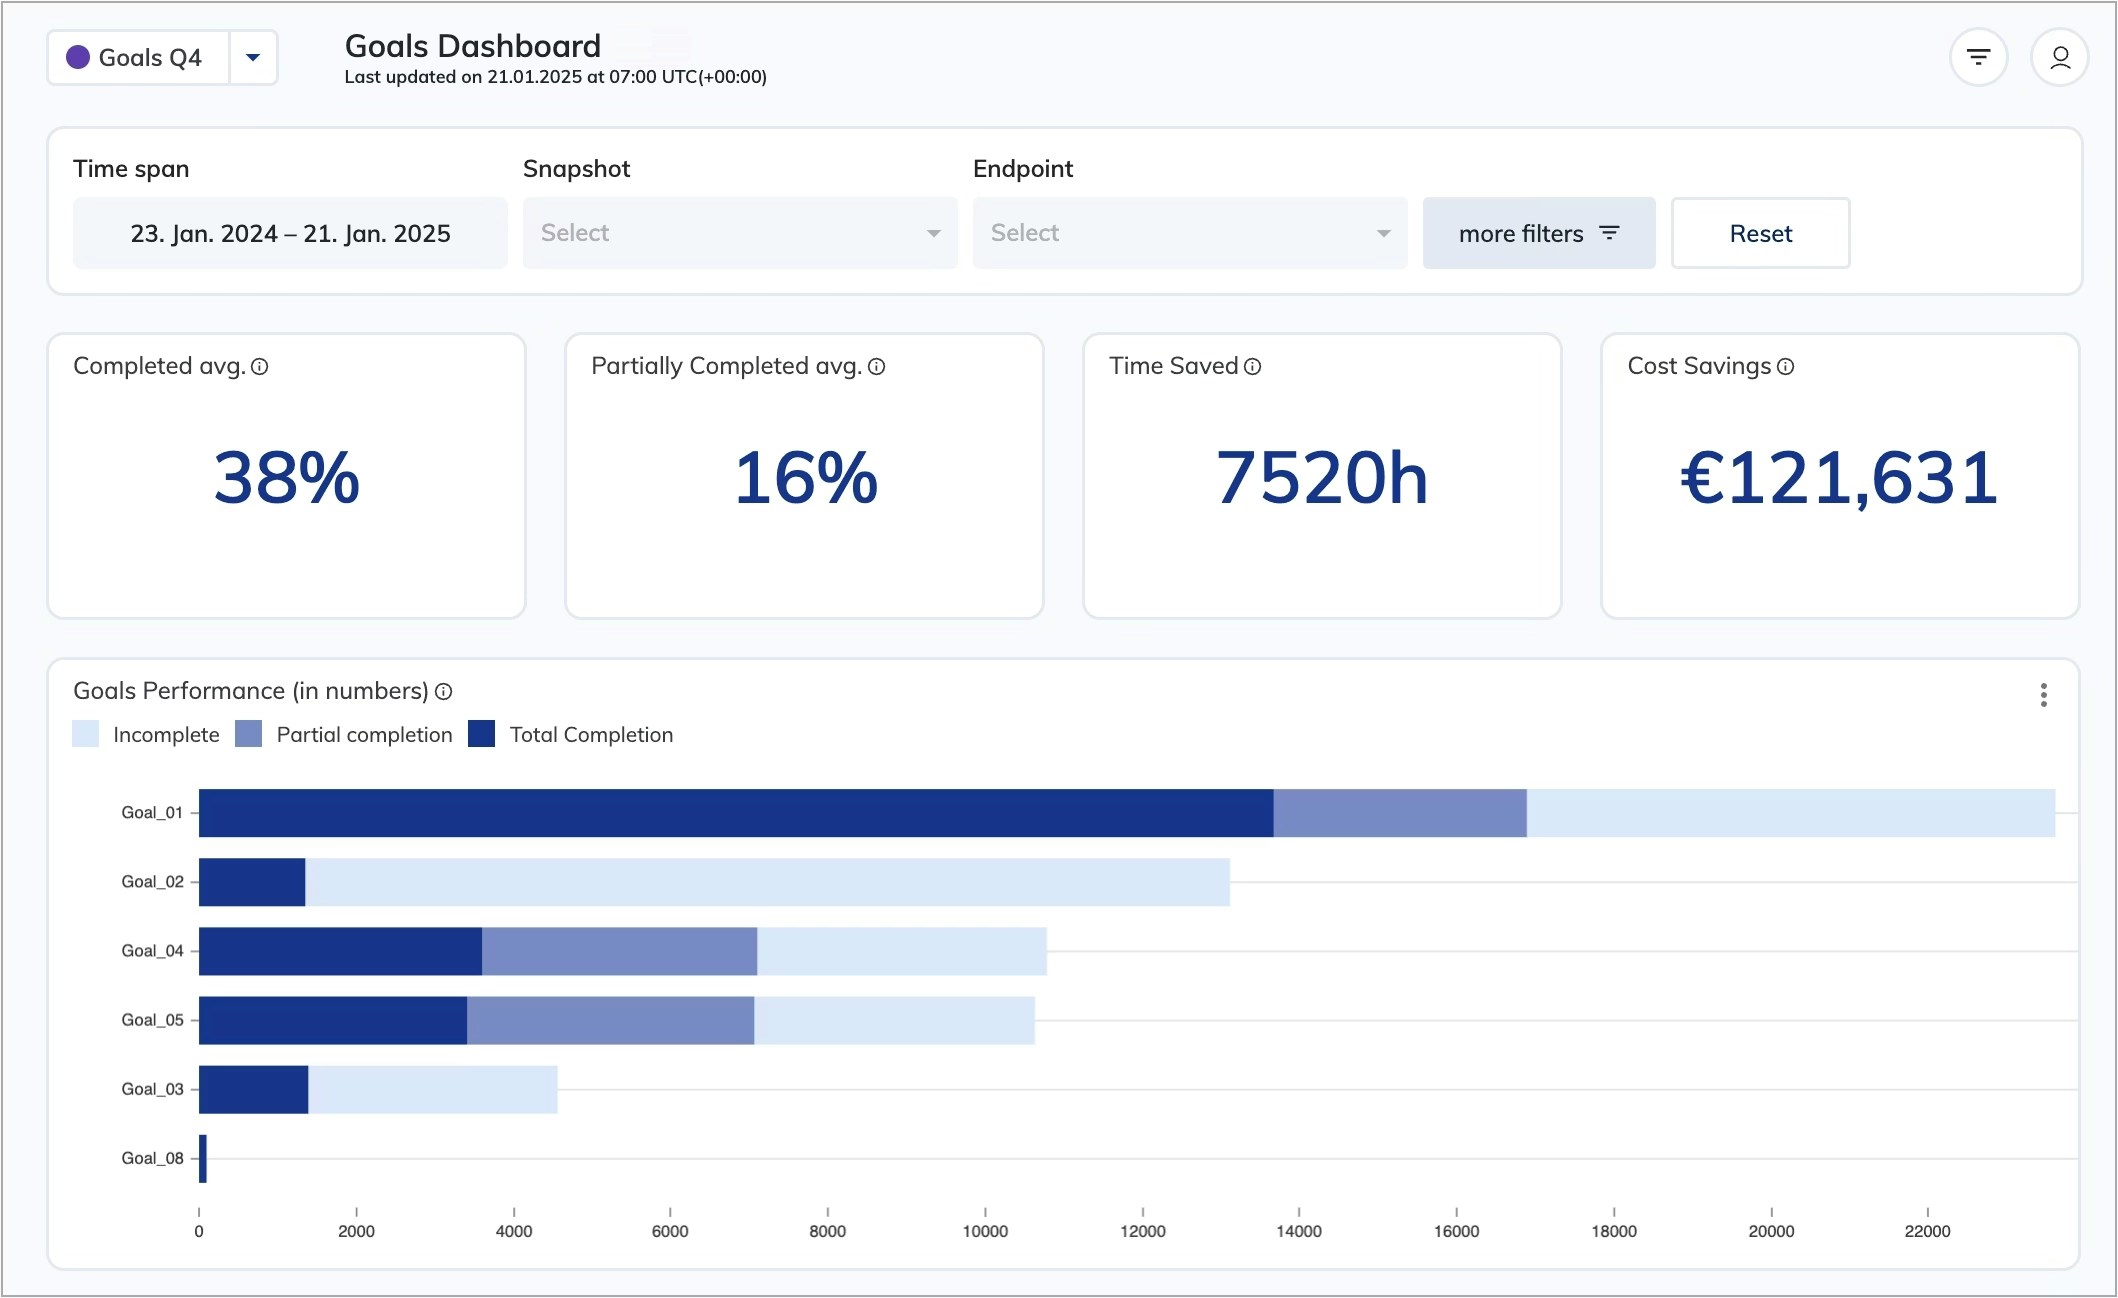
Completed
Displays the total number of completed goals.Partially Completed
Displays the total number of partially completed goals. This chart shows the goals for which some steps were not completed.Time Saved
Displays the total time saved for completed and partially completed goals.Cost Savings
Displays the total cost savings for completed and partially completed goals.Bar charts
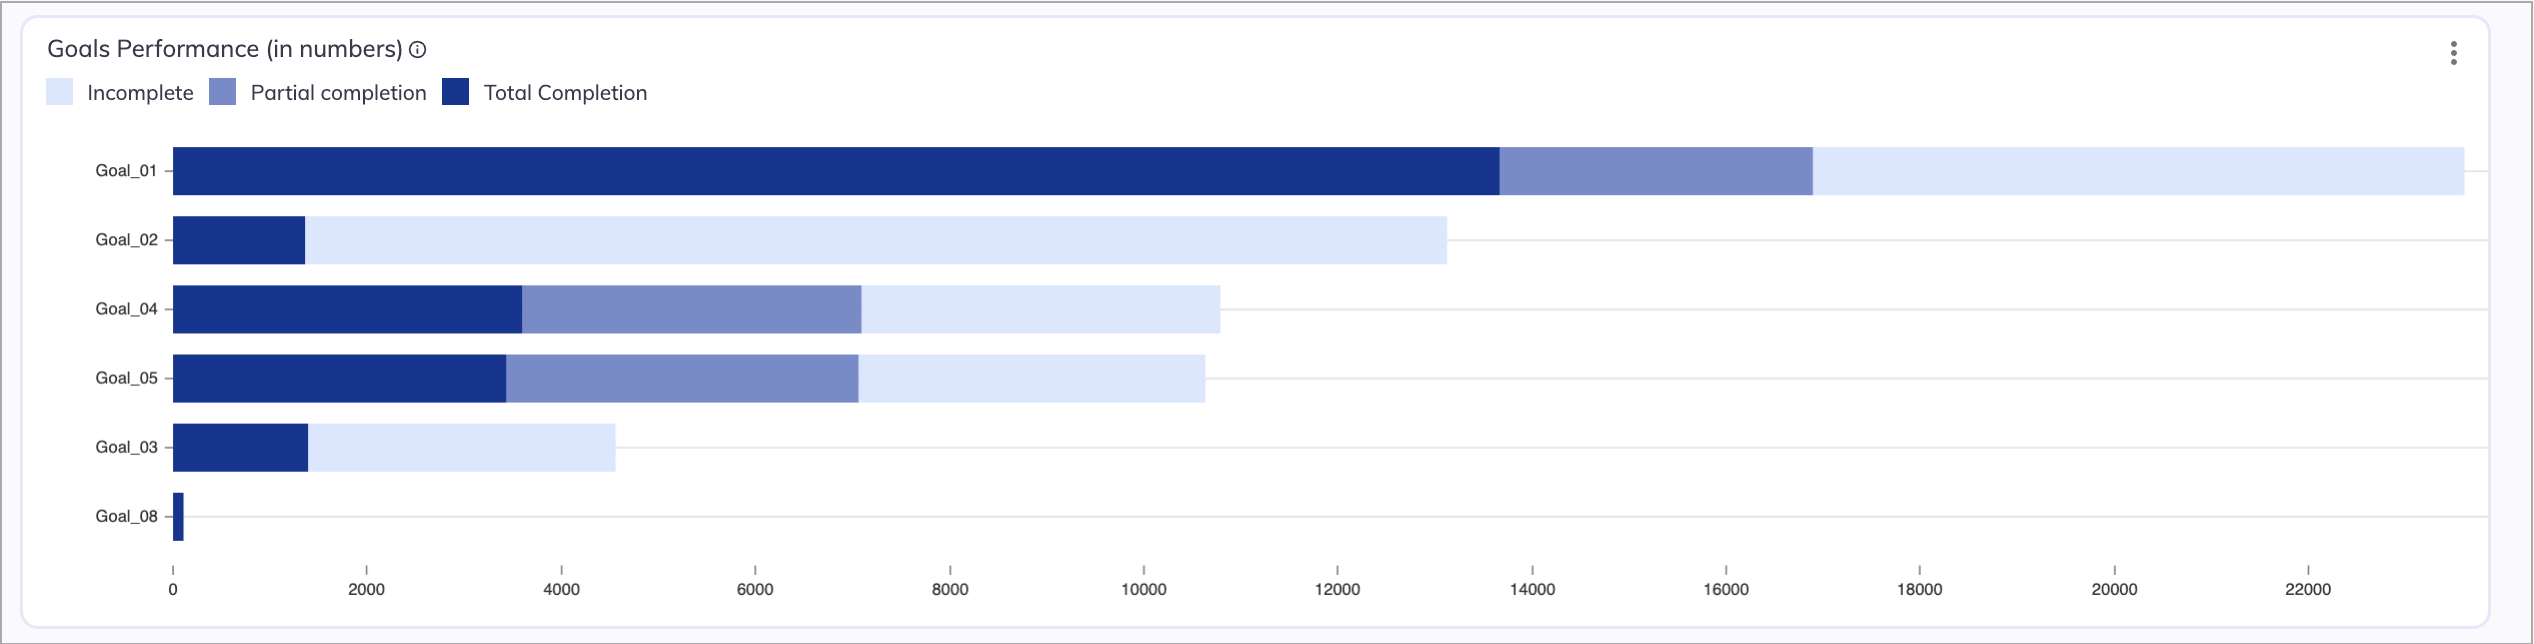
Goals Performance (in numbers)
Displays the number of goals achieved within the selected time span. The goals have three distinct categories, each has a separate bar:- Incomplete — goals that have been started, with only the initial step triggered.
- Partial Completion — goals that have been started and progressed through some steps, but the completion step was not achieved.
- Total Completion — goals that have been started, progressed through some steps, and at least one completion step was achieved.
Time Saved (in hours)
Displays time saved in hours for each goal that was completed within the filtered time span. You can track efficiency gains and compare time saved across different goals. Source table: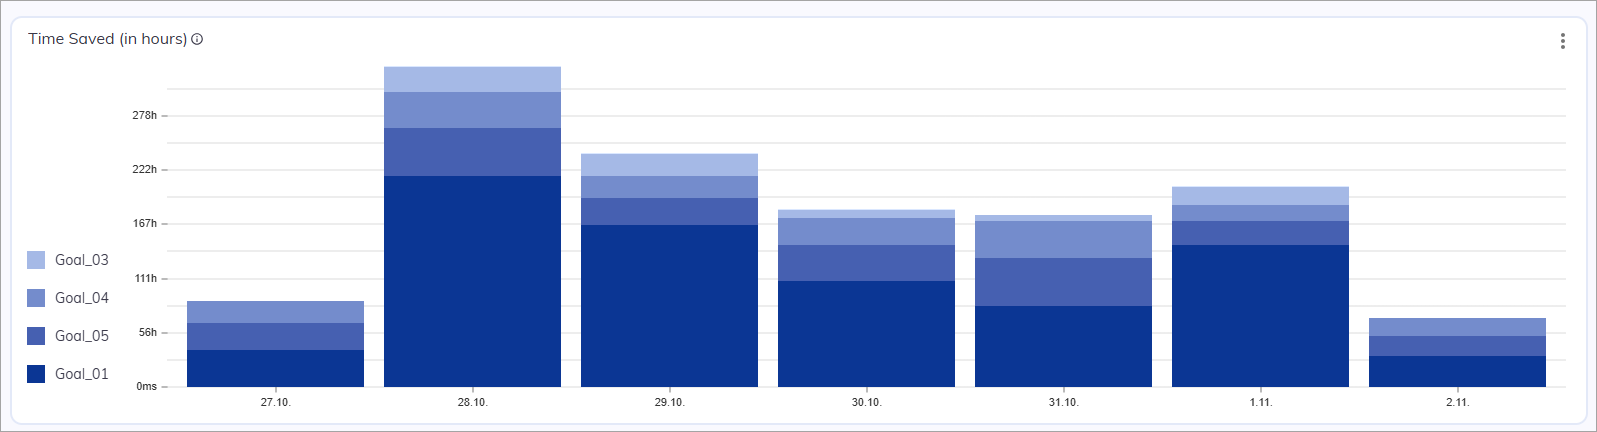
Cost Savings
Displays the amount of the money saved for each goal completed within the selected time span. You can analyze cost savings across different goals, identify the most cost-effective processes, and optimize resource allocation. Source table: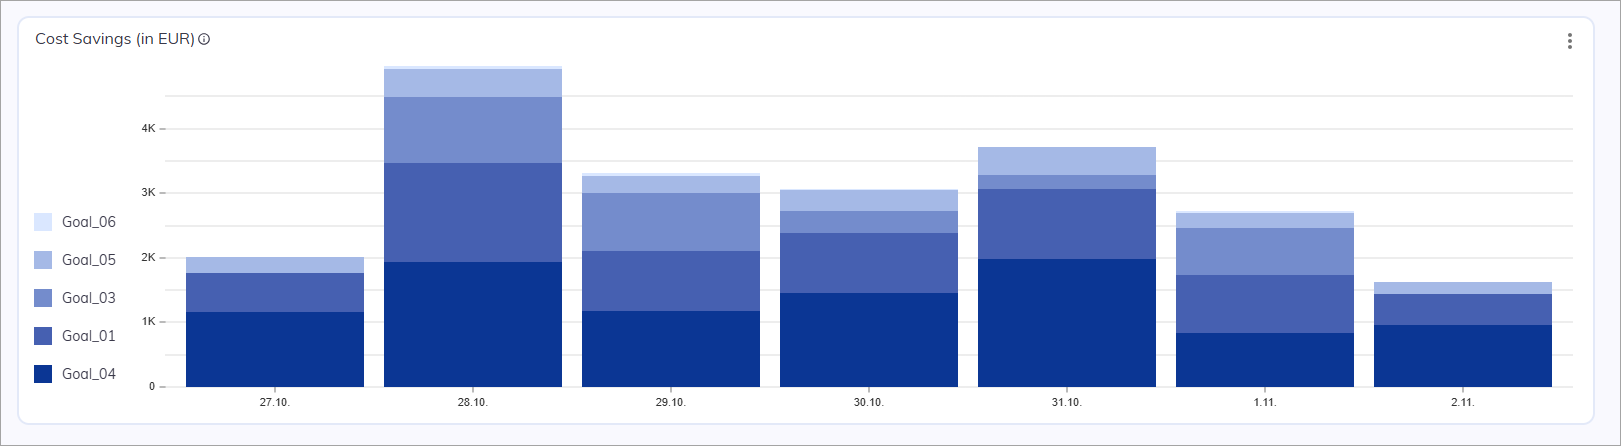
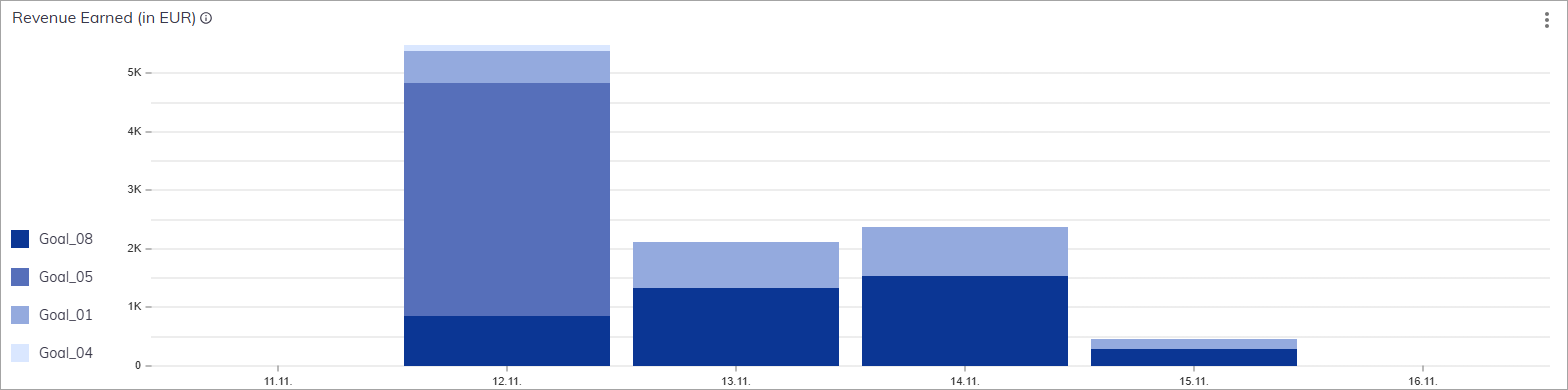
Revenue Earned
Displays the total revenue earned for each goal completed within the selected time period. You can analyze earnings across different goals to identify the most efficient processes. Source table: