

Limitations
- Cognigy retains log entries for up to 24 hours. On-premises administrators can change the retention period.
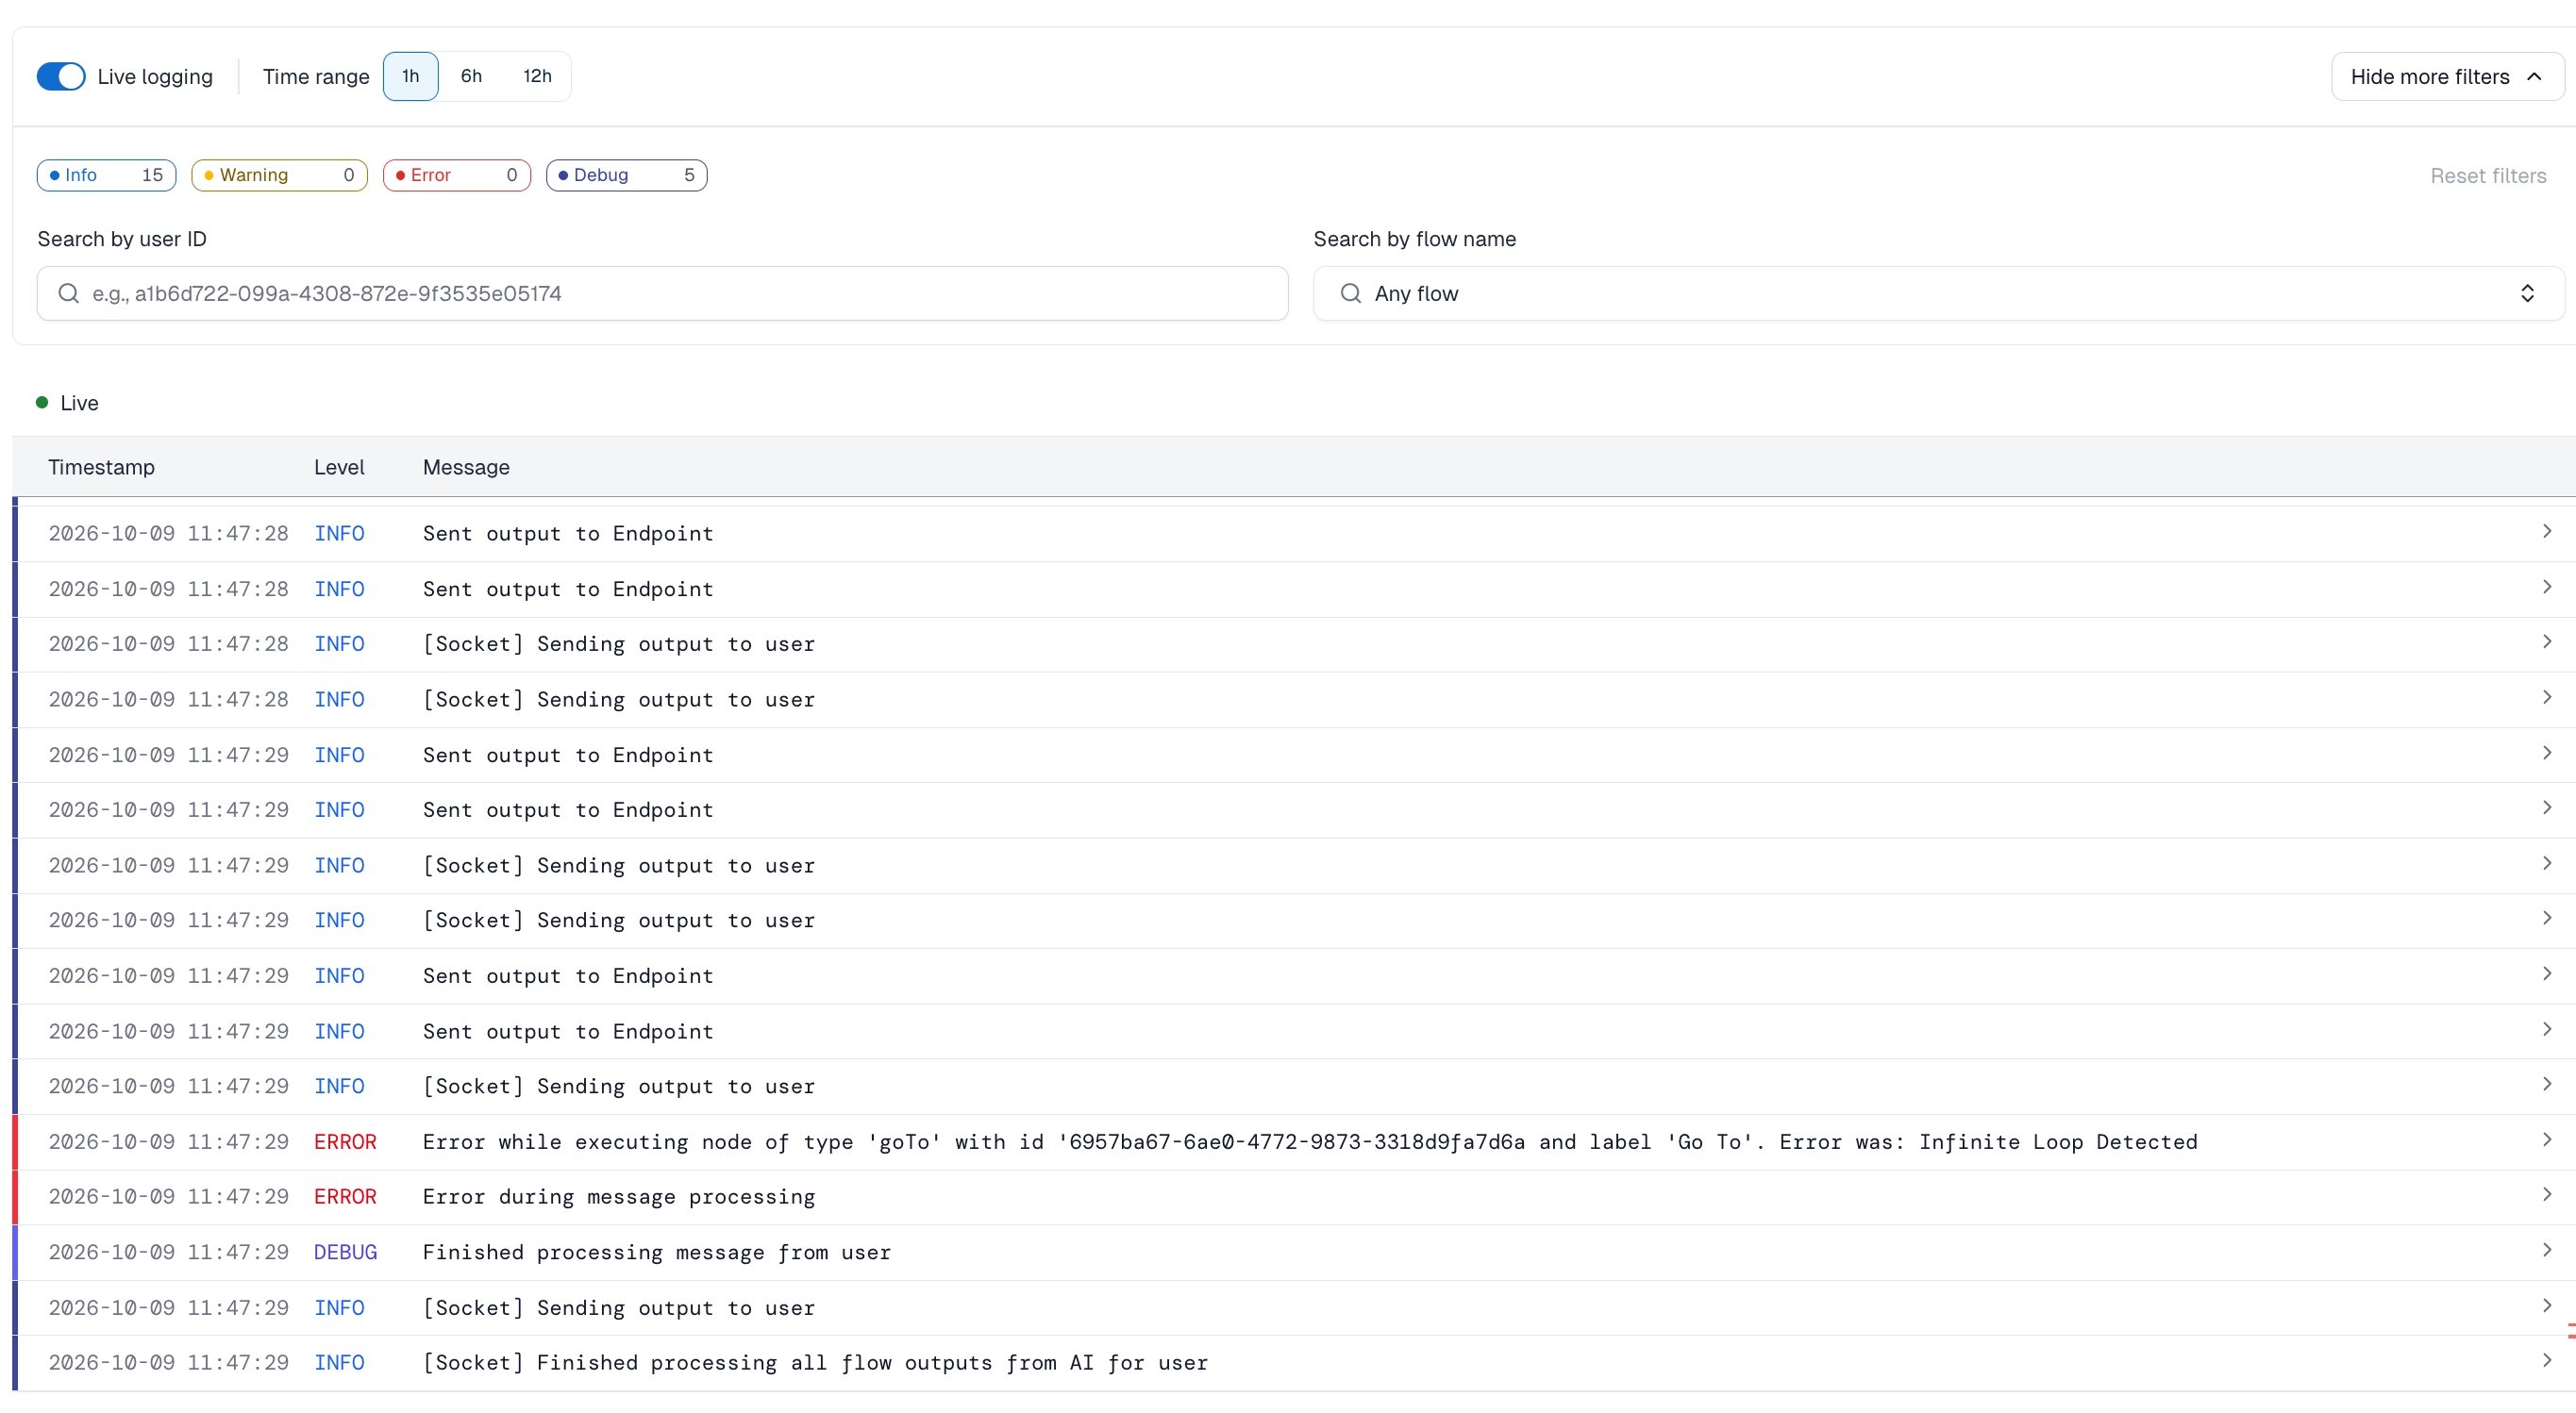
- By default, the Logs page shows the logs of the last hour. To show earlier logs, change the Time range. The options are 1, 6, and 12 hours.
- To view all retained logs, use the GET Log Entries API method. The method returns 25 entries per request by default. To get more, use the
limitparameter and the pagination cursors.
Log entries
The log list shows the following columns:
The log level is one of the following:
To view more information about a log entry, click it. The Log entry details dialog shows the user ID, the Flow, the level, the trace ID, and the metadata. The collapsed Related in this session section lists the log entries from the same session. To copy the entry, click Copy JSON.
Working with logs
View logs
- GUI
- API
The log list uses virtualization to improve browser performance. Your browser loads only the log entries visible on your screen. As a result, you can’t copy more lines than are visible.
To show the level and search settings, click Show more filters. To restore the default values, click Reset filters. The footer shows how many log entries are loaded.